What Calculator Functions Will Save Your Life?
5 min read•july 11, 2024
Rupi Adhikary
AP Calculus AB/BC ♾️
279 resourcesSee Units
On the AP Calculus Exam, you will be required to use a graphing calculator on both the Multiple Choice and Free Response Section. Thus, you should be a master with your calculator by the time you walk into that exam room. Here are some tips to use your calculator to its full potential on the AP Calculus Exam!
Since there are so many graphing calculators out there, we're going to be focusing on the TI-84 and TI-84 plus because they seem to be the ones that most people have. If your calculator isn't mentioned and you'd like an article like this, please let us know!
The majority of the time that you'll be using your calculator is to graph functions and find exact values.
Derivatives
- To find derivatives press 'math' then the number '8'
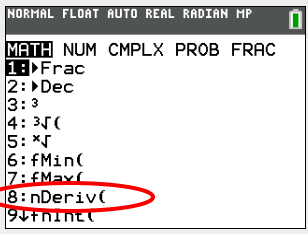
This should lead you to a screen that looks something like this
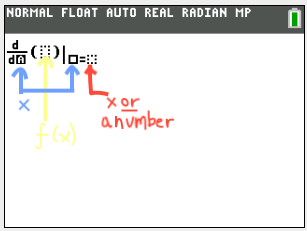
- Here, you can insert the function you're trying to take the derivative of in the parentheses.
- Make sure that you have the variable the derivative is being taken in terms of in the the 'd/d_', which in most cases is just 'x'.
- In the small box outlined in bold, you have to put the same variable you put in the beginning.
- If you look over to the to where the red is, the box outlined in dots is where you would either but 'x' or a number. The only time you can put 'x' here is when you're graphing the derivative. If you put in a value, you would be finding the derivative at a certain point
🎥Watch: AP Calculus - Practicing Derivative Rules
Integrals
- Similar to finding the derivative, press 'math' but then you'll need to press '9'
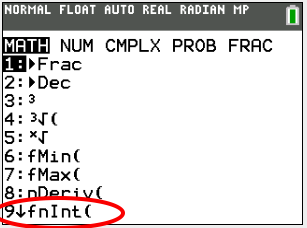
- This should take you to a screen that looks like this
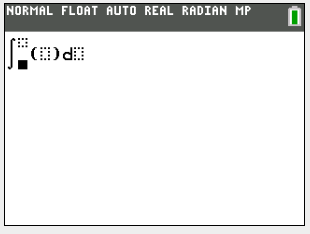
- For definite integrals, you would put your bounds in the two dotted bound boxes at the top and bottom of the integral sign. Your function would go in the parentheses and the variable you're taking the integral in terms of would go next to the 'd'.
- For indefinite integrals, the only time you'd be able to do this is when you're graphing. Everything would stay the same aside from your bounds. At the bottom, you would put 0, and for the top you would but the variable you're taking the integral in terms of (usually x)
🎥Watch: AP Calculus - Integration Techniques
'Y='
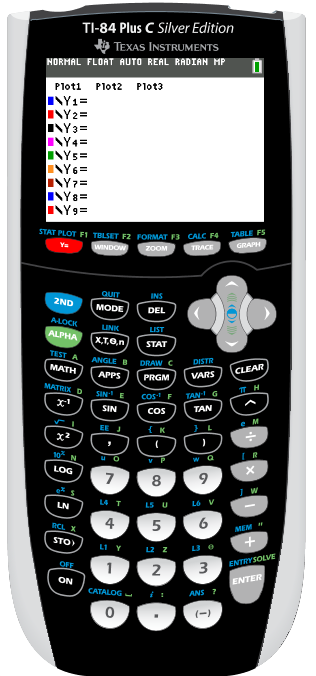
- If you press 'Y=' you'll be taken to a screen that will allow you to put in functions. You probably already know that this is where you would go to graph functions
- If you have the plus, then you can also change the color of the lines if you were to graph them
- In calculus, you'll be using the same function in several different ways and re-typing them each time can waste time and effort. To solve this, type whatever function you have in any of the 'slots' available
- When you need to call for that function, press 'alpha' (the green button) then 'trace' (the fourth button from the left on the top row). You'll be taken to a screen like this
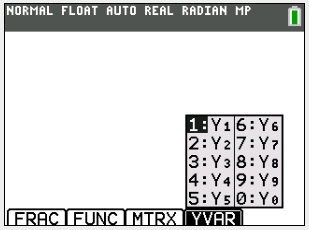
- All you have to do to call the function you need is to press the same 'Y#' that you put your function in!
- This is especially helpful when you have to do find composite functions or use a function for multiple steps
How to get letters/variables
This is one pretty straightforward. All you have to do is press the 'alpha' button and then the button that corresponds to the letter you want.
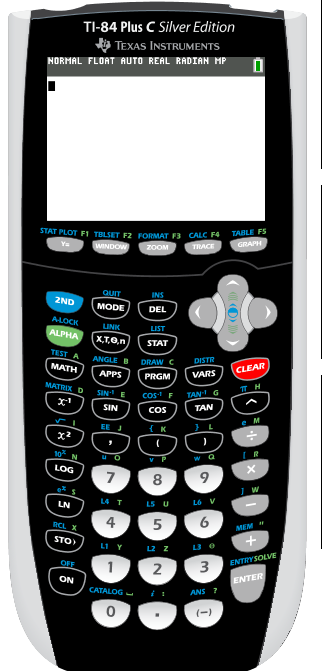
- For example, if I wanted the letter or symbol 'x', I would first press 'alpha' and then 'STO)' because we can see that 'x' is above it.
Quick explanations of some buttons
- WINDOW - here you can put the exact bounds for the graph you'll be seeing (for both x and y)
- TRACE - With this button, you can go along the graph you've created and follow along with the values with the arrows
- ZOOM - allows you to take a closer look or bigger picture of the graph you've created
🎥Watch: AP Calculus - Fundamental Theorem of Calculus & Integral Defined Functions
2ND + TRACE functions
In my experience, these functions have been the most helpful to me in terms of graphing.
These are pretty self-explanatory, but we'll go through them real quick so you can get a good grasp of what they do since they're so important
- Value - you'll be asked to input a value for 'x' and then it will give you the corresponding y-value. It's important that your x-value is within the window that you've created or else it may show an error
- Zero - here, you'll be asked to give a left bound, a right bound, and a guess to where you think your zero would be. To give these criteria, simply use the left and right arrows to navigate and the enter button to submit your placement! This tells you where your function crosses the x-axis
- Minimum and Maximum - this asks for the same steps as the 'zero' button would. This tells you where your function has a minimum or maximum y-value
- Intersect - this button asks for the 'first curve' or the first function and the 'second curve' or the second function, and a guess. However, this can only be used when you have two functions graphed. To move between the two 'curves', use the up and down arrows
- dy/dx - here you can find the derivative of the function you've graphed at a specific point. This will ask you to give an x-value so you can either type it in or move your pointer with the left and right arrows to where you want it
- ∫f(x)dx - this is a pretty straightforward one as well. This function will give you the integral of the graph. All you have to do is put in 'lower' and 'upper' limits, which are just the bounds. You can do this by once again typing them in or moving your cursor around.
🎥Watch: AP Calculus - Critical Points and Points of Inflection
📌 Some more tricks that might save you some time!
- e^x = 2ND + LN
- √ = 2ND + X^2
- e = 2ND + ➗
- absolute value signs = 2ND + 0 + abs(
Browse Study Guides By Unit
👑Unit 1 – Limits & Continuity
🤓Unit 2 – Fundamentals of Differentiation
🤙🏽Unit 3 – Composite, Implicit, & Inverse Functions
👀Unit 4 – Contextual Applications of Differentiation
✨Unit 5 – Analytical Applications of Differentiation
🔥Unit 6 – Integration & Accumulation of Change
💎Unit 7 – Differential Equations
🐶Unit 8 – Applications of Integration
🦖Unit 9 – Parametric Equations, Polar Coordinates, & Vector-Valued Functions (BC Only)
♾Unit 10 – Infinite Sequences & Series (BC Only)
📚Study Tools
🤔Exam Skills

Fiveable
Resources
© 2025 Fiveable Inc. All rights reserved.