Peter Apps
AP Physics 1 🎡
257 resourcesSee Units
AP Physics 1 Labs
Unlike some other courses you may have taken, there are no required labs for AP Physics 1. However, since there is an experimental design FRQ on every exam (except 2020), knowing how to properly perform a laboratory experiment is vital to your success in the course. The CollegeBoard expects about 25% of your class time do be done performing some sort of lab activities, and colleges may request to see evidence of this before accepting your AP credit.
What to Expect in a Lab Activity
In general, a lab activity should help you in one of the following ways:
- Help you gain understanding about a physics concept
- Help you design an experiment to minimize uncertainty and errors
- Help you interpret data (probably thorough graphical relationships)
- Help you derive and test a relationship between two variables.
- Help you prep for the experimental design FRQ
Ideally every lab should cover all of these areas, but just in case they don't, let's walk through some common things you should be able to do after doing several labs.
Design an Experiment to Minimize Errors
This is a key component of the Experimental Design FRQ. In any given experiment, you'll have to deal with 3 main types of errors: Experimental, Systematic, and Random.
Experimental errors are errors that occur through mistakes that are made by you conducting the experiment. A great example of these are timing errors made by using a stopwatch. Your reaction time is included in all of these time measurements and gives a reading that is not accurate. It's not the fault of the stopwatch, or the design of the experiment, but rather simply an artifact of a human using that tool.

Systematic errors are errors that occur due to the equipment itself. For example, a force sensor may not be zeroed before you use it, or you may have zeroed it while holding it vertically but plan on using it horizontally. These errors can often be corrected for if you know about them in advance, but are difficult to correct for after the experiment is already completed. Systematic errors affect the accuracy of the experiment, but not necessarily the precision of the measurements.
Random errors are, well, random. These are errors that occur completely outside of your control. Temperature variations in a classroom, wind blowing during an outside lab, and changing friction between an object and the ground can all be random errors.
In all these cases, the best way to try to minimize these errors is by doing multiple trials. Design your experiment so that every key measurement is taken several times so that an average can be found. Averaging helps reduce random errors and experimental errors such as reaction time.
In addition using tools with less uncertainty in their measurements can help reduce these errors as well. For example, using a pair of photo-gates will give a more precise time than a stopwatch, because we have removed our reaction times from the experiment. Likewise, using a motion sensor instead of a ruler and stopwatch to measure velocity can yield better results. Other examples of this could include using a digital caliper instead of a ruler, a force sensor instead of a spring scale, and a digital balance instead of a triple beam one.
If you're looking for more information on this, check out the College Board's Data Analysis Guide, or Fiveable's Live Stream Reviews covering Uncertainty.
Interpreting and Graphing Data
As I'm sure you're aware of by now, graphing is a wonderful way of determining and verifying relationships between variables in an experiment. A good graph can also help you identify outliers and sources of systemic errors.
When you're making a graph, there are a few things to keep in mind:
When you're making a graph, there are a few things to keep in mind:
- Label each axis with the variable that is plotted on it and its units
- Scale each axis with a reasonable number of labeled tick marks at even intervals. Make sure your chosen scale doesn't cramp the data to only one section of the graph, but spreads it out so that patterns can be seen.
- Plot your independent variable on the x-axis (the one that isn't changed by the other variables you're trying to measure). Most often, this is time or distance
- Plot your dependent variable on the y-axis.
Plotting a Linear Graph from Non-Linear Data
A linear graph is the most useful for helping us verify expectations and determine relationships. It also happens to be the simplest type of graph (y=mx+b). This lets us determine the slope (which often is an important physical quantity, like acceleration from a velocity vs time graph or the spring constant from a Force vs distance graph). We can also easily see if the y-intercept is 0, which can be useful to help diagnose experimental and systematic errors.
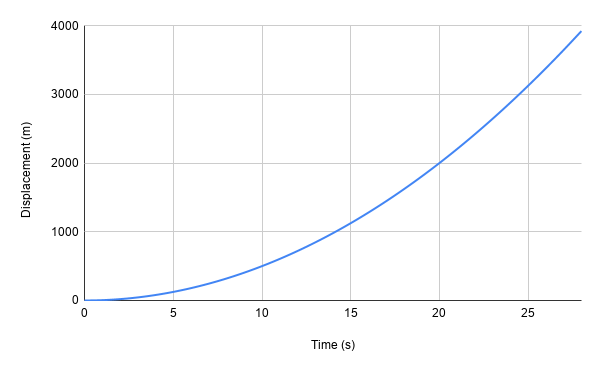
However many times, the relationship we're trying to graph isn't linear. A great example of this is when we're looking at the displacement of an object with a constant acceleration. Simply plotting x vs t gives us a graph like this.

Looking at the graph, we can see that this relationship looks like it's quadratic.

This means that since the general formula for a quadratic is y=ax^2+bx+c, to make a linear graph we need to plot y vs x^2. Once we make that change, the graph becomes linear, and we can find the slope and y-intercept.
.png?alt=media&token=4c06427c-e1e5-47c2-adbd-eb2e3ae0de9d)
Alternatively we could have graphed sqrt(Displacement) vs time and gotten a linear graph, but I think it's always easier to square rather than square-root.
Other common scenarios involve plotting:
- y = 1/x for inverse plots
- log(y) = log(x) for exponential plots.
Browse Study Guides By Unit
👟Unit 1 – Kinematics
🌀Unit 2 – Dynamics
🚀Unit 3 – Circular Motion & Gravitation
⚡️Unit 4 – Energy
⛳️Unit 5 – Momentum
🎸Unit 6 – Simple Harmonic Motion
🎡Unit 7 – Torque & Rotational Motion
💡Unit 8 – Electric Charges & Electric Force
🔋Unit 9 – DC Circuits
🔊Unit 10 – Mechanical Waves & Sound
📚Study Tools
🧐Exam Skills

Fiveable
Resources
© 2025 Fiveable Inc. All rights reserved.