Peter Cao
AP Statistics 📊
265 resourcesSee Units
What is a LSRL?
The simplest form of regression is linear regression where we find a linear equation of the form ŷ=a+bx, where a is the y-intercept and b is the slope. Given a scatterplot, there can be infinitely many linear regression approximations, but there is only one best linear regression model, and this is called the least squares regression line (LSRL). We will discuss this and how to find the formula in a couple of sections.
It is also important to note here that our ŷ represents our predicted response variable value, while x represents our explanatory value variable. Since x is given in a data set, it is not necessarily predicted, but our y-value is always predicted from a least squares regression line.
Extrapolation
Given a linear regression equation, we can find values of the response variable for values of the explanatory variable not given in the data set. This is more accurate if you stay in the domain of the set of values of the explanatory variable. If you go outside this domain, it is now called extrapolation, and farther outside the domain you go, the less accurate your predictions will be.
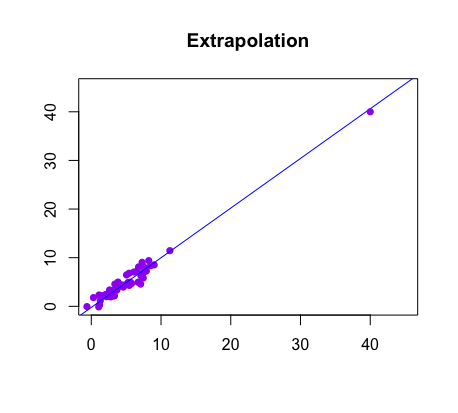
image courtesy of: statsforstem.org comfort
Example
In a recent model built using data for 19-24 year olds, a least squares regression line is developed that says that an individual's comfort level with technology (on a scale of 1-10) can be predicted using the least squares regression line: ŷ=0.32x+0.67, where ŷ is the predicted comfort level and x represents one's age.
Predict what the comfort level would be of a 45 year old and why this response does not make sense.
ŷ=0.32(45)+0.67
ŷ=15.07 comfort level
This answer does not make sense because we would expect our predicted comfort levels to be between 1 and 10. 15.07 does not make sense. The reason why we have this response is because we were using a data set intended for 19-24 year olds to make inference about a 45 year old. We were extrapolating our data to include someone outside our data set, which is not a good idea. 🙅♂️💡
🎥Watch: AP Stats - Least Squares Regression Lines
Browse Study Guides By Unit
👆Unit 1 – Exploring One-Variable Data
✌️Unit 2 – Exploring Two-Variable Data
🔎Unit 3 – Collecting Data
🎲Unit 4 – Probability, Random Variables, & Probability Distributions
📊Unit 5 – Sampling Distributions
⚖️Unit 6 – Proportions
😼Unit 7 – Means
✳️Unit 8 – Chi-Squares
📈Unit 9 – Slopes
✏️Frequently Asked Questions
✍️Free Response Questions (FRQs)
📆Big Reviews: Finals & Exam Prep
Fiveable
Resources
© 2023 Fiveable Inc. All rights reserved.