Peter Cao
AP Statistics 📊
265 resourcesSee Units
When evaluating the effectiveness of a linear regression model, we use residuals to do this. But what is a residual? Well, they’re just the difference between the actual data and the value predicted by a linear regression model, or y-ŷ. A point closer to the best fit line has a smaller residual while a point farther from the best fit line has a larger residual. But what does this all mean? Well, if we have a positive residual, then the actual value is greater than the predicted value and we say that the model underestimates the true value by a certain amount. Likewise, if we have a negative residual, then the actual value is less than the predicted value and we say that the model overestimates the true value by a certain amount.
Residual Plots
Residual plots plot the residuals of a model relative to values of the explanatory variable. Here are two examples of scatterplots with linear regression models and also their residual plots as well.
Example 1
In the example below, we can see that our linear regression model fits our data fairly well (scatterplot on left). Therefore, the residual plot (on right) seems to show no apparent pattern. Our red points seem equally scattered about the red line at 0.
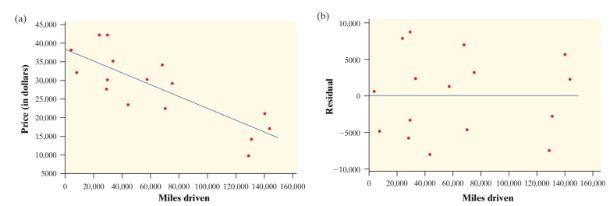
Courtesy of Starnes, Daren S. and Tabor, Josh. The Practice of Statistics—For the AP Exam, 5th Edition. Cengage Publishing.
Example 2
In this data, we can clearly see that our data follows a curved pattern, not the linear model pictured (scatterplot on left). Therefore, our residual plot (on right) shows an apparent curved pattern. We will learn more about these types of models in Unit 2.9 and how to adjust these to create a linear model.
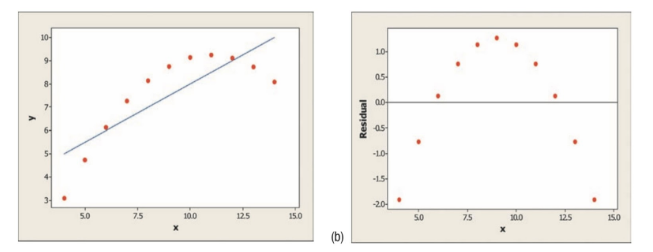
Courtesy of Starnes, Daren S. and Tabor, Josh. The Practice of Statistics—For the AP Exam, 5th Edition. Cengage Publishing.
Good or Bad? 🧐
How do we tell whether a model is good? Look at the residual plot. For a good model, the residuals should be randomly scattered and have no clear pattern like with the first set above. In the second set, there is a distinct curve in the residual plot, meaning that a linear regression model is not appropriate to the scatterplot and a nonlinear model would be best.
Calculating Residuals
In order to calculate a residual for a given data point, we need the LSRL for that data set and the given data point.
We will first calculate the predicted value using the LSRL. Then, we subtract the predicted value from the actual value in the given data point. In other words, our formula is Residual=(Actual)-(Predicted).
Example
A LSRL model for the predicted amount of Lucky Charms eaten in accordance with one's age in years is given by the equation below:
ŷ=150.5x-2.34
A 50 year old from our data set is said to have eaten 7,500 lucky charms in his life! Wow! I hope he found the 💰 at the end of the 🌈! Calculate the residual for his number.
ŷ=150.5(50)-2.34
ŷ=7522.66
Residual is 7500-7522.66=-22.66.
Keep in mind that sometimes you may be asked to calculate one's actual data point (or predicted data point) when given the residual. This would require the same formula, but working backwards.
🎥Watch: AP Stats - Least Squares Regression Lines
Browse Study Guides By Unit
👆Unit 1 – Exploring One-Variable Data
✌️Unit 2 – Exploring Two-Variable Data
🔎Unit 3 – Collecting Data
🎲Unit 4 – Probability, Random Variables, & Probability Distributions
📊Unit 5 – Sampling Distributions
⚖️Unit 6 – Proportions
😼Unit 7 – Means
✳️Unit 8 – Chi-Squares
📈Unit 9 – Slopes
✏️Frequently Asked Questions
✍️Free Response Questions (FRQs)
📆Big Reviews: Finals & Exam Prep
Fiveable
Resources
© 2023 Fiveable Inc. All rights reserved.