6.11 Carrying Out a Test for the Difference of Two Population Proportions
3 min read•june 11, 2020
Josh Argo
AP Statistics 📊
265 resourcesSee Units
Calculating Values
There are two important values that we need to calculate in order to carry out a test for the difference in two population proportions. We need to calculate a z-score and a p-value. Both need to be included in our response to receive full credit.
Z-Score
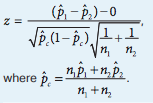
The z-score for our test is our critical value. We can calculate it by using the formula for any z-score:


That formula looks pretty 🤢, so luckily if we run our test on a calculator, the z-score is part of our calculator output.
P-Value
As with any p-value, we are using the normal curve and our z-score to calculate the probability of obtaining such a value (or one less than/greater than) that value. Also, using a calculator here is much easier than doing it by hand.
Concluding Test
Once we have our p-value and z-score, we can then make a judgment to either reject or fail to reject our null hypothesis.
Using P-Value
If we are using our p-value, we are inspecting if it is lower than our given significance level (0.05 if not specified). If our p-value is really low, this means that it was an extremely rare occurrence (WOW value!) and we have reason to believe our null hypothesis (center of our sampling distribution) wasn't accurate.
Therefore, if the p is low, reject the Ho.
Using Z-Score
If you are using the z-score, you are going to use the empirical rule of a normal distribution to check if our z-score represents an extremely rare value on our sampling distribution. Any z-score higher than 2 or 3 gives us reason to reject the Ho.
Continued Example
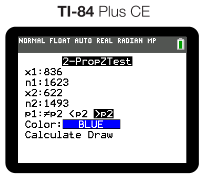
Let's continue our example of MJ vs. Lebron to see if we can verify our conclusion from Unit 6.9. Recall that Michael Jordan made 836/1623 shots and Lebron James made 622/1493 shots. We are seeing if our data gives significant statistical evidence that Michael Jordan is actually better than Lebron.
Calculations
To avoid the lengthy and cumbersome formulas above, we are going to use a graphing calculator and the appropriate "2 Prop Z Test" to test our hypothesis:


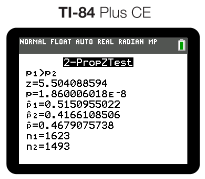
The two big values that we need to write down from our output is our z-score and p-value.
Conclusion
To conclude our test, we can look at how low our p-value is, or how high our z-score is.
P-Value
Our p-value is the best way to conclude. In this problem, we can see that our p-value is essentially 0. Therefore, we can say:
"Since our p-value is less than 0.05 (~0<0.05), we reject our Ho. We have convincing evidence that the true population proportion of shots made by MJ is higher than the true population proportion of shots made by Lebron."
Notice that this supports our conclusion from the confidence interval.
Z-Score
If not given the data to calculate a p-value or if only given the z-score, we can still make a judgment on the null hypothesis. In the example above, we end up with a z-score of 5.5, which is pretty extreme. Therefore, we can conclude that we can reject our null hypothesis in favor of our alternate hypothesis.
Browse Study Guides By Unit
👆Unit 1 – Exploring One-Variable Data
✌️Unit 2 – Exploring Two-Variable Data
🔎Unit 3 – Collecting Data
🎲Unit 4 – Probability, Random Variables, & Probability Distributions
📊Unit 5 – Sampling Distributions
⚖️Unit 6 – Proportions
😼Unit 7 – Means
✳️Unit 8 – Chi-Squares
📈Unit 9 – Slopes
✏️Frequently Asked Questions
✍️Free Response Questions (FRQs)
📆Big Reviews: Finals & Exam Prep

Fiveable
Resources
© 2023 Fiveable Inc. All rights reserved.