6.8 Confidence Intervals for the Difference of Two Proportions
4 min read•june 5, 2020
Josh Argo
AP Statistics 📊
265 resourcesSee Units
When Can I Use 2 Prop Z Interval?
Have you ever seen two athletes and wondered how much better one was than the other? Maybe a basketball player who is REALLY good at three pointers and another who seems to be just as good. How can you tell if one is actually better than the other?
One way to look at that is to determine what the difference in their shot percentage is by using a confidence interval. A confidence interval will give us a range of numbers that the difference in their percentages will be within.
Necessary Conditions
As with any forms of inference, we have some necessary conditions to check. These are essential anytime we are using a sample to make an inference about a population.
🌟Random
Probably the most important condition is that we need to be sure that both of our samples come from random samples. If we don't take a random sample from our population, then our findings suffer from sampling bias and we are stuck and we can't generalize our findings to our population. 😞
🌟Independence
To check that our sample is independent, we need to make sure that both of our populations are at least 10 times that of our samples. Also, if we are dealing with a randomized experiment, the random assignment of treatments classifies our samples as independently selected.
🌟Normal
When dealing with proportions, we always check our normal condition by using the Large Counts Condition, which states that our expected successes and failures is at least 10. Since we have two samples in this type of test, we have to check this condition for both samples. In other words,

This verifies that our confidence interval is based off of a normal sampling distribution.
How Do I Calculate?
As I am sure you remember from Unit 6.2, a confidence interval is based on two aspects: a point estimate and a margin of error. A confidence interval for the difference of two population proportions is no different.
Point Estimate
In the case of a confidence interval for two proportions, the point estimate is the difference in our two sample proportions. We can find this by simply subtracting the two sample proportions, or p-hats.
Margin of Error
As before, our margin of error is the buffer zone that we add and subtract to our point estimate to be sure that our interval encompasses our true population proportion difference. This is based off of two things: our critical value (z-score) and our standard error.
Total Formula
Our total formula as found on the AP Statistics Course Exam Description looks like this:
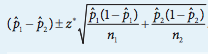
image courtesy of: apcentral.collegeboard.org
Using a Calculator
A much more efficient way of calculating a confidence interval for the difference of two population proportions is to use some form of technology such as a graphing calculator. On most common calculators, you will select "2 Prop Z Interval" from the Stats/Tests menu.
Example
The age old argument of MJ vs. Lebron has risen again. In an effort to prove your point, you take their two career shots made percentages to see if they are REALLY different. To test this claim, you decide to construct a confidence interval for the difference in their proportion of shots. We take a sample of MJ shots and Lebron's shots from their first season in NBA. According to basketball-reference.com, MJ attempted 1623 field goals his first season, making 836 of them. Lebron attempted 1493 field goals, making 622 of his shots. Construct and interpret a 95% confidence interval to determine their difference in proportions of shots made.
Conditions
- Random: Since the problem looked at their first season, we will assume they were "randomly chosen". Sometimes problems don't specify that it was randomly selected so we have to assume they were and proceed.
- Independent: Since it is reasonable to believe that MJ took at least 16,230 shots in his career and Lebron has taken at least 14,930 shots, we will say they are independent samples.
- Normal: Both MJ and Lebron had at least 10 makes and misses from their samples, so we can use a normal approximation for the sampling distribution of the difference in their proportion of shots made.
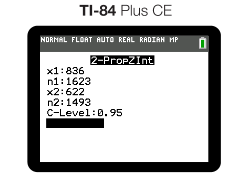
Do Calculations
Using a calculator for our calculations, we entered our data into "2 Prop Z Interval"
Which gives us the following interval:
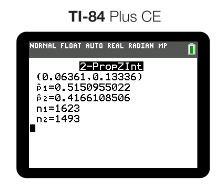
To find out more about how to interpret this interval, click ahead to Unit 6.9...
🎥Watch: AP Stats - Inference: Confidence Intervals for Proportions
Browse Study Guides By Unit
👆Unit 1 – Exploring One-Variable Data
✌️Unit 2 – Exploring Two-Variable Data
🔎Unit 3 – Collecting Data
🎲Unit 4 – Probability, Random Variables, & Probability Distributions
📊Unit 5 – Sampling Distributions
⚖️Unit 6 – Proportions
😼Unit 7 – Means
✳️Unit 8 – Chi-Squares
📈Unit 9 – Slopes
✏️Frequently Asked Questions
✍️Free Response Questions (FRQs)
📆Big Reviews: Finals & Exam Prep
Fiveable
Resources
© 2023 Fiveable Inc. All rights reserved.