7.9 Carrying Out a Test for the Difference of Two Population Means
3 min read•june 5, 2020
Josh Argo
AP Statistics 📊
265 resourcesSee Units
Now that we have checked out conditions for inference, we can calculate the two aspects that are necessary for a significance test: our test statistics and p-value.
Calculating Test Statistics
The first and necessary aspect of our calculations is calculating our t-score. Since we are dealing with quantitative data (means), we need to find our degrees of freedom first.
Degrees of Freedom
- When calculating by hand, we will take the smaller of the two samples and subtract 1. This is the same as we did in Unit 7.5 with 1 sample.
- When performing the test with technology such as a graphing calculator, the degrees of freedom will be given with the output.
Critical Value (t-score)
To calculate our critical value, we used the typical formula:
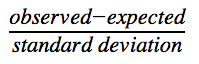
To make it more specific for a t-score with the difference of two population means, our formula simplifies to:
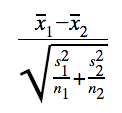
This can be found on the Formula Sheet by simplifying the given formulas.
Calculating P Value
Now that we know our appropriate degrees of freedom and our t-score, we can refer to our Formula Sheet and refer to the appropriate row for our df. Looking across the tow, find the t-score value that is closest to the one you calculated for the t-score. Use the tail probability that most closely coordinates to your t-score.
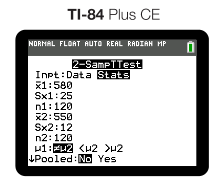
A more exact way of calculating the p-value is to perform a 2 sample t-test in some form of technology such as a graphing calculator. As with any t-procedure, you are given the option of typing in the statistical information or entering in the data in list 1.
Once you enter the test in, the output gives you the t-score, df and p-value for your test. On the AP test, it is essential that you write down ALL 3 of these on your response to receive full credit.
For our green bean example from Unit 7.8, this is what our input would look like:
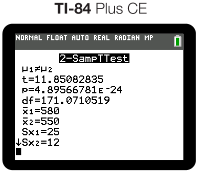
And our output would be as follows:
Testing Statistical Claim
Now that you have the numbers you need, you can check the statistical claim of the null hypothesis.
As with any significance test, we are checking to see if our p is lower than the significance level. If our p is low, we reject the null with convincing evidence of the alternate hypothesis. If the p is not lower than the significance level, we fail to reject the null hypothesis.
Once you make your decision, you should be able to see if in fact there is a difference in your two populations.
For our green bean example, our conclusion would be as follows:
Since our p value is essentially 0 and less than 0.05, we reject our Ho. We have convincing evidence that the true mean number of green beans picked from Field A differs from that picked in Field B.
I made sure to compare our p-value to our significance level, reject/fail to reject Ho, and have evidence/not have evidence of the Ha. Also, my answer is in context.
🎥Watch: AP Stats - Review of Inference: z and t Procedures
Browse Study Guides By Unit
👆Unit 1 – Exploring One-Variable Data
✌️Unit 2 – Exploring Two-Variable Data
🔎Unit 3 – Collecting Data
🎲Unit 4 – Probability, Random Variables, & Probability Distributions
📊Unit 5 – Sampling Distributions
⚖️Unit 6 – Proportions
😼Unit 7 – Means
✳️Unit 8 – Chi-Squares
📈Unit 9 – Slopes
✏️Frequently Asked Questions
✍️Free Response Questions (FRQs)
📆Big Reviews: Finals & Exam Prep
Fiveable
Resources
© 2023 Fiveable Inc. All rights reserved.