7.5 Carrying Out a Test for a Population Mean
3 min read•june 5, 2020
Josh Argo
AP Statistics 📊
265 resourcesSee Units
Calculating T-Score
The first step in actually performing any statistical significance test is to calculate the test statistic used for that particular test. Since we are carrying out a significance test for a population mean, we should calculate a t-score.
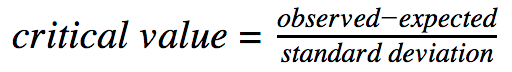
When calculating a t-score, we use the general formula for critical values:
When we specify this formula for a t-score, we get the following:
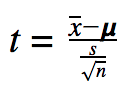
Where x̄ is our sample mean, 𝞵 is our hypothesized sample mean, s is our standard deviation of our sample and n is our sample size.
Example
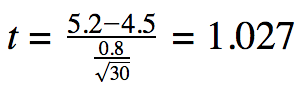
Ricardo has a bag of 30 🍊. The bag says that each orange weighs an average of 4.5 oz.
Ricardo weighs all of the oranges in his bag and finds that they have an average of 4.65 oz with a standard deviation of 0.8 oz.
Calculating P-Value
When performing a hypothesis test, we could be performing either a one tailed or two tailed test. This depends on our alternate hypothesis when setting up our test. If our alternate hypothesis features either a greater than or less than sign, we are performing a one tailed test, because we are looking for a t-score only in one tail of our curve. If our alternate hypothesis has a "not equal to" sign, we will perform a two tailed test since we are looking to find a t-score in either tail of our curve.
We will then need to reference our t-score chart to calculate our p value.
First, lets determine the degrees of freedom, which is always one less than our sample size.
Then, we find our t-score in the column matching our given degrees of freedom to estimate our p-value. If the degrees of freedom can not be found in the chart, round down to the nearest df.
Example
In our example above with Ricardo's 🍊s, our df=29. So we need to locate 29 df on the chart and then try to find 1.027.
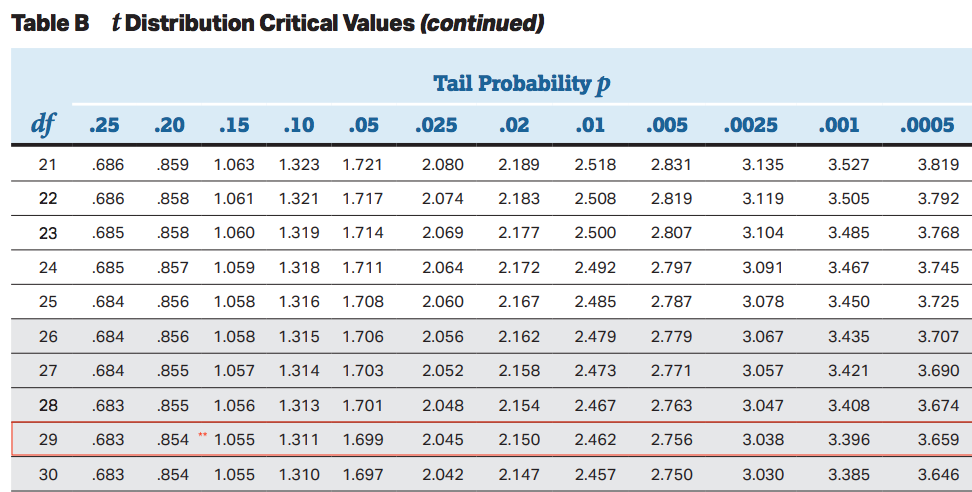
We can see in the t table, that the tail probability with df=30 and t-score of 1.027 is approximately 0.15 (since its close to 1.055).
If we are doing a one tailed test, this is our p-value.
If we are doing a two tailed test, we would double this to get 0.3 for our p-value (since the t curve is symmetric and tail probabilities are equal).
Using Calculator to Calculate T Score and P Value
Perhaps a much easier way to perform a one sample t test would be to use technology such as a graphing calculator. The most commonly used calculator for AP Statistics is the Texas Instruments TI-84.
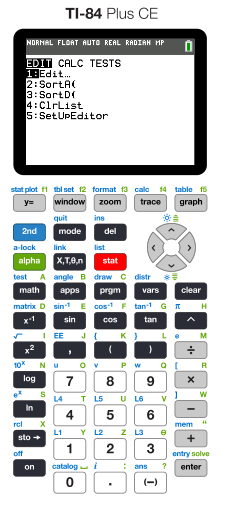
When performing a one sample t test, you will first enter into the stats menu:
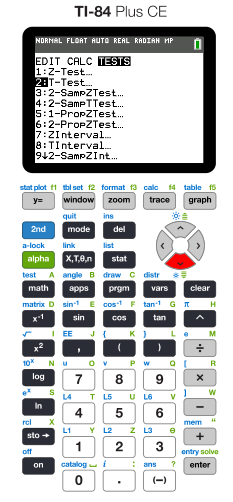
Then, you will navigate over to tests and select option 2:
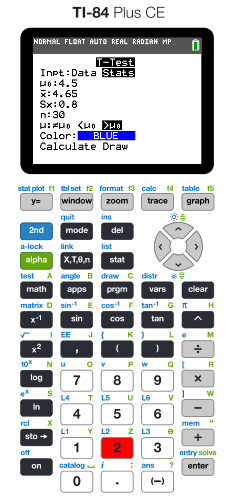
You are then given two options: you can enter the given sample statistics or let the calculator use data points entered in Lists to calculate your necessary test statistic and p value. We will proceed with our example using Ricardo's 🍊s.
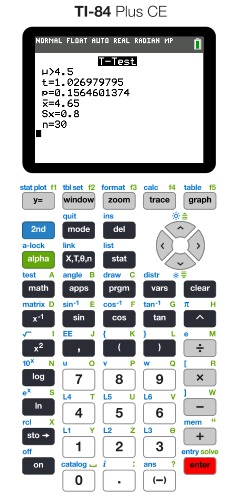
Once you press calculate, it gives you your test statistic and p value. Both of these things are essential to list out in your written response to receive full credit on the AP exam. Also, it is important for a t-test for population mean to include your degrees of freedom, even though it is not listed in the computer output for the test.
Using P Value to Make Conclusions
Once you have calculated your test statistic and p value, you are ready to draw inference and make conclusions from your test. You are always going to compare your p-value to your significance level (usually 0.05). If your p is less than your significance level, you reject your null hypothesis in favor of the alternate hypothesis. If your p is not less than your significance level, you fail to reject your null hypothesis.
Templates
- p<𝞪: Since p<𝞪, we reject our Ho. We have convincing evidence at the 𝞪 level that (Ha in context of problem).
- p>𝞪: Since p>𝞪, we fail reject our Ho. We do not have convincing evidence at the 𝞪 level that (Ha in context of problem).
We NEVER "accept" a null or alternate hypothesis.
Browse Study Guides By Unit
👆Unit 1 – Exploring One-Variable Data
✌️Unit 2 – Exploring Two-Variable Data
🔎Unit 3 – Collecting Data
🎲Unit 4 – Probability, Random Variables, & Probability Distributions
📊Unit 5 – Sampling Distributions
⚖️Unit 6 – Proportions
😼Unit 7 – Means
✳️Unit 8 – Chi-Squares
📈Unit 9 – Slopes
✏️Frequently Asked Questions
✍️Free Response Questions (FRQs)
📆Big Reviews: Finals & Exam Prep
Fiveable
Resources
© 2023 Fiveable Inc. All rights reserved.