7.2 Constructing a Confidence Interval for a Population Mean
4 min read•june 5, 2020
Josh Argo
AP Statistics 📊
265 resourcesSee Units
Conditions for Inference
Before proceeding to calculate a confidence interval, we have to check that our sampling distribution we are using meets some conditions:
✅ Random Sample
This reduces any bias that may be caused from taking a bad sample
When answering inference questions, it is always essential to make note that our sample was random, either by highlighting text on the exam, or by quoting the problem where it details its randomness.
✅ Independence
This ensures that each subject in our sample was not influenced by the previous subjects chosen. While we are sampling without replacement, if our sample size is not super close to our population size, we can conclude that the effect it has on our sampling is negligible. We can check this condition by questioning if it is reasonable to believe that the population in question is at least 10 times as large as our sample.
A good way to state this when performing inference is to say, "It is reasonable to believe that our population (in context) is at least 10n"
For example, if we have a random sample of 85 teenagers math grades and we are creating a confidence interval for what the average of ALL teenager math grades are, we could state, "It is reasonable to believe that there are at least 850 teenagers currently enrolled in a math class."
✅Normal
This check verifies that we are able to use a normal curve to calculate our probabilities using either empirical rule or z scores. We can verify that a sampling distribution is normal using the Central Limit Theorem which states that if our sample size is at least 30, we can assume that the sampling distribution will be approximately normal. Normality with our sampling distribution can also be assumed if it is given that the population distribution is normally distributed.
With our example with 85 teenagers, we can assume that the sampling distribution of 85 teenagers grades will be a normal distribution because 85>30.
Formula
A confidence interval is comprised of two parts: a point estimate and a margin of error.
Point Estimate ± Margin of error
Point Estimate ± (t*)(standard error)
Point Estimate
A point estimate is the middle of our confidence interval. If we are estimating a population mean, our point estimate is our sample mean (aka x̄).
Margin of Error
A margin of error can be thought about as a "buffer zone." It is the amount that we add and subtract to our sample mean to give some room for error in estimating our population mean. It is made up of two parts:
- Critical Value
- Standard Error
The critical value is the t-score based on the mean and standard deviation of the sampling distribution, along with the degrees of freedom. Degrees of freedom can be calculated by taking the sample size and subtracting one. Since we have a distribution that is only approximately normal, the degrees of freedom allow us to adjust our calculations based on how small or large our sample is. If we had an infinite sample size, we would have a perfect normal curve (which would call for us to use a z-score). A critical value can be calculated using either a calculator's inverse T function or using the charts on the College Board provided formula sheet.
The standard error is the standard deviation of the sampling distribution. The formula for that can also be found on the
formula sheet linked above.
formula sheet linked above.
Meaning of Confidence Interval
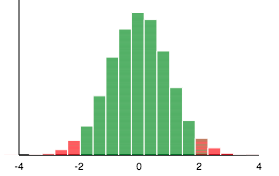
image provided by: rossmanchance.com
A confidence interval is a range of values that we believe the true population mean will fall between. In the example above, we have a 95% confidence interval when given a sample mean of 0, sample standard deviation of 10 and a sample size of 100. The graphic shows this sampling distribution and how only 5% of the samples would fall outside of the (-2,2) range. Hence, we can be 95% confident that the true population mean is somewhere between -2 and 2.
Interpretation
On the AP exam, you are typically asked to create and interpret a confidence interval.
When asked to do this for a population mean, interpret your interval using the following template:
I am ___% confident that the true population mean of ______________ is between (___, ___).
Rubrics generally include the following three aspects:
- Confidence level
- Context of problem
- Demonstrates knowledge that we are inferring about the true population mean
Browse Study Guides By Unit
👆Unit 1 – Exploring One-Variable Data
✌️Unit 2 – Exploring Two-Variable Data
🔎Unit 3 – Collecting Data
🎲Unit 4 – Probability, Random Variables, & Probability Distributions
📊Unit 5 – Sampling Distributions
⚖️Unit 6 – Proportions
😼Unit 7 – Means
✳️Unit 8 – Chi-Squares
📈Unit 9 – Slopes
✏️Frequently Asked Questions
✍️Free Response Questions (FRQs)
📆Big Reviews: Finals & Exam Prep
Fiveable
Resources
© 2023 Fiveable Inc. All rights reserved.