7.4 Setting Up a Test for a Population Mean
4 min read•june 5, 2020
Josh Argo
AP Statistics 📊
265 resourcesSee Units
Identifying Test
When given a statistical claim from an article or previous study, the first necessary thing to do is to identify the test needed. Some key phrases you will see that tells us that a statistical significance test is called for is "do the data give convincing evidence..." or "is there convincing evidence of...."
When one of these key phrases appear in the prompt, we then need to determine if our data is categorical data or quantitative data. If we have quantitative data, we will set up a test for a population mean. As with confidence intervals, a test for population mean will make use of t-scores. If we only have one sample, we will perform a one sample t-test.
Significance Level
One major aspect of our significance test is the significance level. The significance level is displayed by the greek letter alpha (𝞪). The significance level is generally understood to be 0.05 unless specified otherwise.
The lower the significance test, the lower probability it is to get a statistically significant outcome from our sample. It is important to select an 𝞪 that is low enough to prove that our sample statistic is significant, but not so low that a otherwise significant sample statistic isn't recognized as significant. This is why 0.05 is a good middle ground.
Connection to Confidence Interval
A significance level is directly connected to a one sample t-interval. If we have a significance level of 0.05, we would be looking at a sample statistic that would NOT occur in our 95% confidence interval. If we select a significance level of 0.02, it matches with a 98% confidence interval. In summation, the complement of our significance level will match with the confidence level of the matching confidence interval.
Example
In the image below, we see a 95% confidence interval in the non-shaded region for a mean of 0 and 29 df. The shaded region is known as the rejection region. This is the region in which a statistic is significant enough (in accordance with its 𝞪 level) to reject the claimed population mean. In this example, any sample statistic greater than 2.04 or less than -2.04 would lead us to doubt that the true population mean is 0.
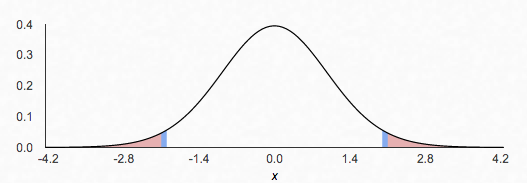
image created with: https://homepage.divms.uiowa.edu/~mbognar/
Writing Hypotheses
Once we have identified our test and significance level, we need to identify and write our hypothesized values. We have two hypotheses: null and alternate.
Null Hypothesis(Ho)
The null hypothesis directly comes from our claim from the previous study or article. With a one sample t test, this will be our hypothesized population mean. Our null hypothesis is ALWAYS going to be 𝞵=hypothesized population mean (in number format).
Alternate Hypothesis(Ha)
The alternate hypothesis is what we are lead to believe from our sample statistic. With a one sample t-test, our alternate hypothesis is always going to be either 𝞵≠, 𝞵< or 𝞵> our hypothesized population mean from our null hypothesis.
Example
A recent study has found that the average number of school days missed by a high school senior is 5.2 days. After taking a random sample of 150 high school seniors, our sample has an average of 4.1 days missed with a standard deviation of 0.4. Do the data give convincing evidence that the average number of days missed by a high school senior is less than the claim from the study?
- Ho: 𝞵=5.2
- Ha: 𝞵<5.2
For this example, our null hypothesis comes directly from the study. The alternative hypothesis comes from the fact that the question implies that we are checking to see if the actual value is less than the hypothesized value.
Checking Conditions
Once we have our test confirmed and our hypothesis developed, we need to check our conditions for inference to be sure that our test can accurately be carried out. Just as with confidence intervals, we have 3 conditions:
- Random
- Independent
- Normal
Random
If we are planning on using our sample statistics to develop a statistical test, it is imperative that our sample was chosen randomly. This is important because we are planning on using our sample mean to draw inference or conclusions about our population mean.
If our sample is not chosen randomly to mirror our population, we cannot make statistical claims about the given population.
Independence
Since we are more than likely sampling without replacement, our sample is not truly independent. However, if our sample is not super close to the population, the effect of sampling without replacement is said to be negligible enough that our sample is essentially independent.
To check that this condition is met, we must verify that it is reasonable to believe that our population is at least 10x that of our sample.
You should state, "It is reasonable to believe that there are ____(10n) _________(in context of our population)"
Normal
Since we will be using the normal curve in our next unit to actually calculate the values necessary to perform our test, we need to assure that our sampling distribution is approximately normal.
There are three options to check this:
- Central Limit Theorem (sample size is at least 30)
- Population is given to be approximately normal.
- Distribution of sample data looks approximately symmetric with no apparent outliers or gaps. This can be shown with a quick, modified box-plot sketch of our sample data.
Checking these conditions in this order will be the least cumbersome attempt in verifying the normal condition. Only one is necessary to verify normality.
🎥Watch: AP Stats - Inference: Hypothesis Tests for Means
Browse Study Guides By Unit
👆Unit 1 – Exploring One-Variable Data
✌️Unit 2 – Exploring Two-Variable Data
🔎Unit 3 – Collecting Data
🎲Unit 4 – Probability, Random Variables, & Probability Distributions
📊Unit 5 – Sampling Distributions
⚖️Unit 6 – Proportions
😼Unit 7 – Means
✳️Unit 8 – Chi-Squares
📈Unit 9 – Slopes
✏️Frequently Asked Questions
✍️Free Response Questions (FRQs)
📆Big Reviews: Finals & Exam Prep
Fiveable
Resources
© 2023 Fiveable Inc. All rights reserved.