8.2 Setting Up a Chi Square Goodness of Fit Test
4 min read•may 12, 2021
Josh Argo
AP Statistics 📊
265 resourcesSee Units
8.2: Setting Up a Chi Square Goodness of Fit Test
Goodness of Fit
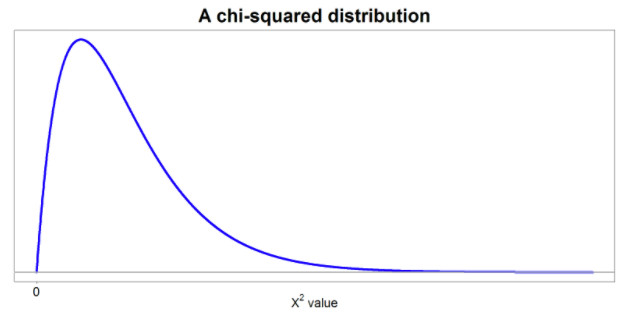
The first variation of a chi-squared test we will run is a chi square goodness of fit test. A goodness of fit test (GOF in your calculator🖩) is used when evaluating the fit of one categorical variable with multiple categories. In the past when observing one categorical variable, we were limited to two categories, so only binary examples.
For instance, we could look at a group of people and whether they answered yes or no, but we could not determine if they answered on a scale of 1-5. Since a scale of 1-5 would have 5 categories that participants could fall into, we could not perform a 1 Prop Z Test, so we would have to use something a bit more complex, like a chi-squared goodness of fit test.
Parameters
It is important to specify what our parameters are when performing inference. In the case of chi-squared GOF tests, we will have multiple population proportions that we are trying to check against a claim.
For example, if we survey a group of people on their scale of happiness 1-5 with 5 being the happiest and we have a claim that says:
- 10% said they were unhappy (1),
- 15% said they were somewhat unhappy (2),
- 28% said they were sometimes happy and sometimes sad (3),
- 30% said they were happy (4), and
- 17% said they were always happy (5)
Then our parameter we would be testing would be the true proportion of 1s, 2s, 3s, 4s and 5s.
Hypotheses
Null Hypothesis
Just as with any inference test, we must have both a null hypothesis and an alternate hypothesis. Our null hypothesis is generally what we would expect to happen if everything goes according to plan. There is nothing different going on than what our original claim was.
In the example of our happiness scale of 1-5, our null hypothesis would be as follows:
Ho: p1=0.1
p2=0.15
p3=0.28
p4=0.3
p5=0.17
It is very important when writing our hypotheses to include context. In the example that we have just done, adding a subscript of 1,2,3,4 or 5 gives us context since the problem was dealing with a survey score of 1-5. It is also a good idea to identify p1=true proportion of people who rated 1 as their happiness score, etc. for other scores.
Alternate Hypothesis
Our null hypothesis is normally very simple. It is best to just state that at least one of the proportions in our null hypothesis is incorrect. Since all of our proportions add up to 100%, one of our null proportions being incorrect leads to others being incorrect as well.
For example, on the happiness scale problem as noted above, our alternate hypothesis would be:
Ha: At least one of the proportions measuring people’s happiness is incorrect.
As always, context is key and can cause your score to be docked!
Conditions
Chi-squared tests require two similar conditions as previous inference tests:
- Our sample must be random
- 10% rule: Our population must be at least 10x our sample
Instead of checking for a normal distribution, we have to make sure that our expected counts are at least 5.
In our happiness scale example, we would take our sample size and multiply by 0.1, 0.15, 0.28, 0.3 and 0.17 to ensure that we would expect to have at least 5 fall into each category.
**If performing an experiment by random assignment of treatments, the independence condition is assumed (10% condition) and the random assignment suffices for the random condition.
Example
A recent survey established that when choosing their favorite between Harry Potter, Lord of the Rings and Star Wars, the answers were the same with ⅓ picking each of the series.
To test this claim, a random sample of 2500 US adults was surveyed about their favorite movie/book series. To check this test, write your hypotheses and check conditions for inference.
Hypotheses and parameter
Ho: pHP=0.33, pSW=0.33, pLOTR=0.33
Ha: At least one of the proportions of favorite movie/book series is incorrect.
pHP=true proportion of people who prefer Harry Potter,
pSW=true proportion of people who prefer Star Wars,
pLOTR=true proportion of people who prefer Lord of the Rings
Conditions
- Random: “A random sample of 2500 US adults” (quote the problem)
- Independence: It is reasonable to believe that there are 25,000 adults in the US (10% condition)
- Large Counts: 2500(0.33)=825>5 (same for all three proportions)
In the next section, we will finish the problem by going through and calculating our test statistic and p-value based on our actual counts from our sample.
🎥 Watch: AP Stats Unit 8 - Chi Squared Tests
Browse Study Guides By Unit
👆Unit 1 – Exploring One-Variable Data
✌️Unit 2 – Exploring Two-Variable Data
🔎Unit 3 – Collecting Data
🎲Unit 4 – Probability, Random Variables, & Probability Distributions
📊Unit 5 – Sampling Distributions
⚖️Unit 6 – Proportions
😼Unit 7 – Means
✳️Unit 8 – Chi-Squares
📈Unit 9 – Slopes
✏️Frequently Asked Questions
✍️Free Response Questions (FRQs)
📆Big Reviews: Finals & Exam Prep
Fiveable
Resources
© 2023 Fiveable Inc. All rights reserved.