Josh Argo
AP Statistics 📊
265 resourcesSee Units
Unit 9: Inference for Quantitative Data: Slopes
What is "inference"?
Remember from Units 6-8, that inference is a HUGE part of statistics. In fact, it is the most important and useful part of the AP Statistics course (and it's also tested very heavily). Inference is the act of using a sample to either make a prediction or test a claim about a population parameter.
In Unit 8, we looked at a more complicated way of doing inference for categorical data by using inference procedures for categorical data with multiple categories (data presented in a two way table). In this unit, we are going to look at a more complex inference procedure for quantitative data by looking at bivariate data instead of univariate data. Therefore, our data will be presented in a scatterplot.
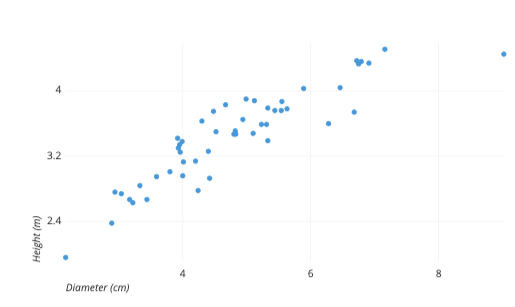
What is a scatterplot?
A scatterplot is the most useful way to display bivariate quantitative data. One variable for each data point is displayed on the x-axis and one variable is displayed on the y-axis. As seen in the example above, this often allows us to see correlation or patterns in our data points.
Explanatory Variable
- The explanatory variable, or independent variable, is the variable that is typically found along the x axis. One way to remember this is that this variable is what does the “explaining” of the patterns we are generally seeing in the overall layout of the scatterplot.
Response Variable
- The response variable, or dependent variable, is the variable that is typically found along the y axis. One way to remember this is that this variable “responds” to the other variable in building our pattern. Also, it “depends” on the other variable.
Example Variable
- For example, let’s say we are investigating the correlation between shoe size and height. Ask yourself, “Does shoe size depend on height, or does height depend on shoe size?” While either of these make sense and would give a similar pattern on a scatterplot, it is more reasonable to say that someone’s shoe size typically depends on their height. Therefore, shoe size is the dependent variable and should be found on the y axis.
Inference with Scatterplots
As you can recall from Unit 2, our linear regression models have several parts: a slope, y-intercept, r value, and r2 value. While an r value and r2 value do a good job at determining how correlated our points are along a scatterplot, they don’t quite give us the inference procedure with hypotheses and being able to say that there is evidence of correlation.
This is where our t interval for slopes and t test for a slope come in to give us not just one value for a slope, but a range of possible values that we can be confident contains the true slope of our regression model rather than just one prediction.
T Interval
- As with all of the other units involving inference, the first form of inference procedure we are doing is constructing a confidence interval. A confidence interval is a form of inference that allows us to predict the true slope of our regression line. While our sample scatterplot gives us one slope, adding in one point can change this model greatly. So rather than honing in on just one slope, adding a margin of error to that slope gives us a range of values that we can be pretty certain contains the true slope of our linear regression model for ALL possible points.
T Test
- The other form of inference in scatterplots is a t test. In this type of inference, we will be testing a null hypothesis that states that the slope between our two variables is 0 (ie, there is no relation). After running our test, we can determine if there is enough evidence that hypothesis needs rejecting in favor of another hypothesis (that the slope is not 0). This type of test closely correlates with our r value in that the stronger our r value, the more likely we are to reject our null hypothesis.
🎥 Watch: AP Stats Unit 9 - Inference for Slopes
Browse Study Guides By Unit
👆Unit 1 – Exploring One-Variable Data
✌️Unit 2 – Exploring Two-Variable Data
🔎Unit 3 – Collecting Data
🎲Unit 4 – Probability, Random Variables, & Probability Distributions
📊Unit 5 – Sampling Distributions
⚖️Unit 6 – Proportions
😼Unit 7 – Means
✳️Unit 8 – Chi-Squares
📈Unit 9 – Slopes
✏️Frequently Asked Questions
✍️Free Response Questions (FRQs)
📆Big Reviews: Finals & Exam Prep
Fiveable
Resources
© 2023 Fiveable Inc. All rights reserved.