J
Jeanne Stansak
I
Isabela Padilha Vilela
AP Macroeconomics 💶
99 resourcesSee Units
Unit 1 - Supply
Definition of Supply
Supply is the different quantities of goods and services that firms are willing and able to produce at various price levels. Understanding the relationship between supply and demand is crucial to determine the equilirium price. 🏷
Quantity Supplied vs. Supply
Quantity supplied is the amount of a good or service that is produced at a particular price level.
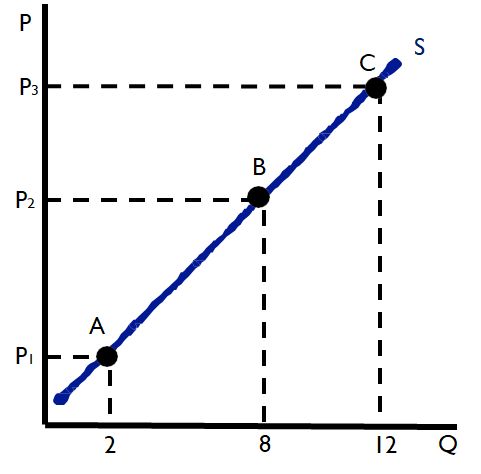
Below is a supply curve. Quantity supplied is one point on the curve (i.e. A, B, or C), and supply is the entire line, including all of the points that create it.

Law of Supply
The law of supply states that the relationship between the price level and the quantity demanded of a good or service is direct, or positive. As the price level rises, firms are more willing or more able to produce a greater quantity, and, therefore, produce more. As the price level falls, firms are less willing or less able to produce the same quantity, and, therefore, produce less.
In summary:
- When price level increases, the quantity of a good supplied increases.
- When price level decreases, the quantity of a good supplied decreases.
Using the chart above, when the price rises from P1 to P2, the quantity supplied increases from 2 units to 8 units. When the price drops from P3 to P2, the quantity supplied decreases from 12 units to 8 units.
💡The only thing that changes quantity supplied is the price of the good or service.
Let's take a look at another graph:
In the graph above, it is possible to observe that point 🅰️ has a price of $100 and a quantity supplied of 50.
When the price increases from $100 to $110 at point 🅱️ the quantity supplied also increases to 90. This exemplified the positive relationship between supply and price.
Determinants of Supply
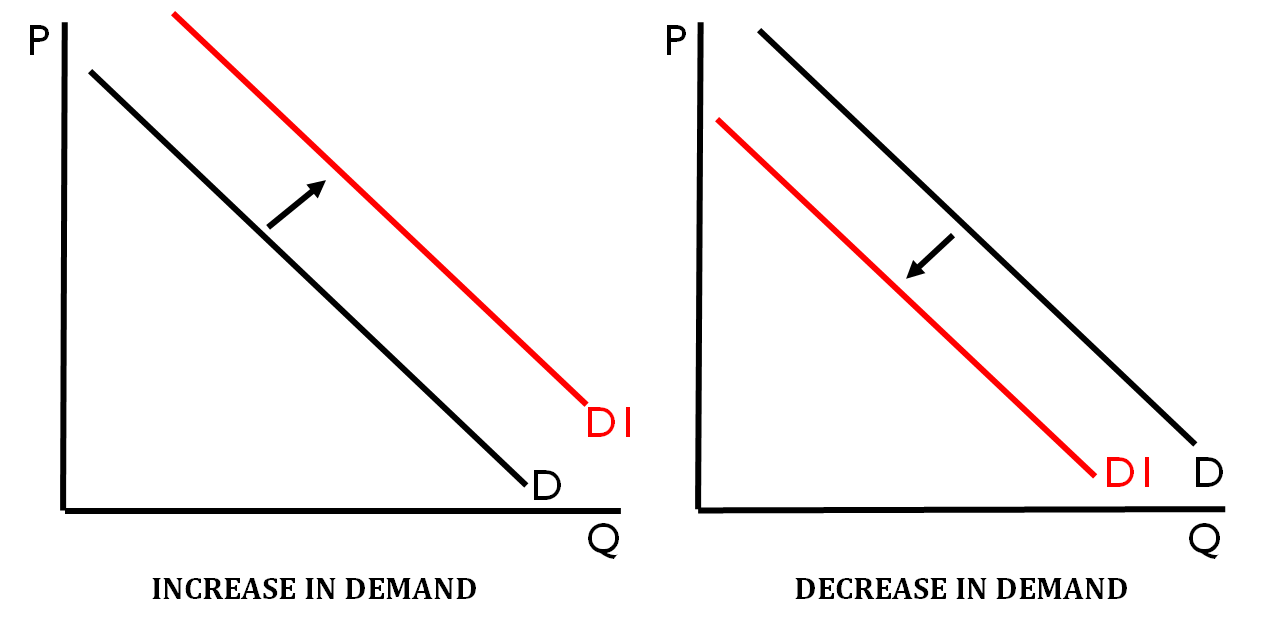
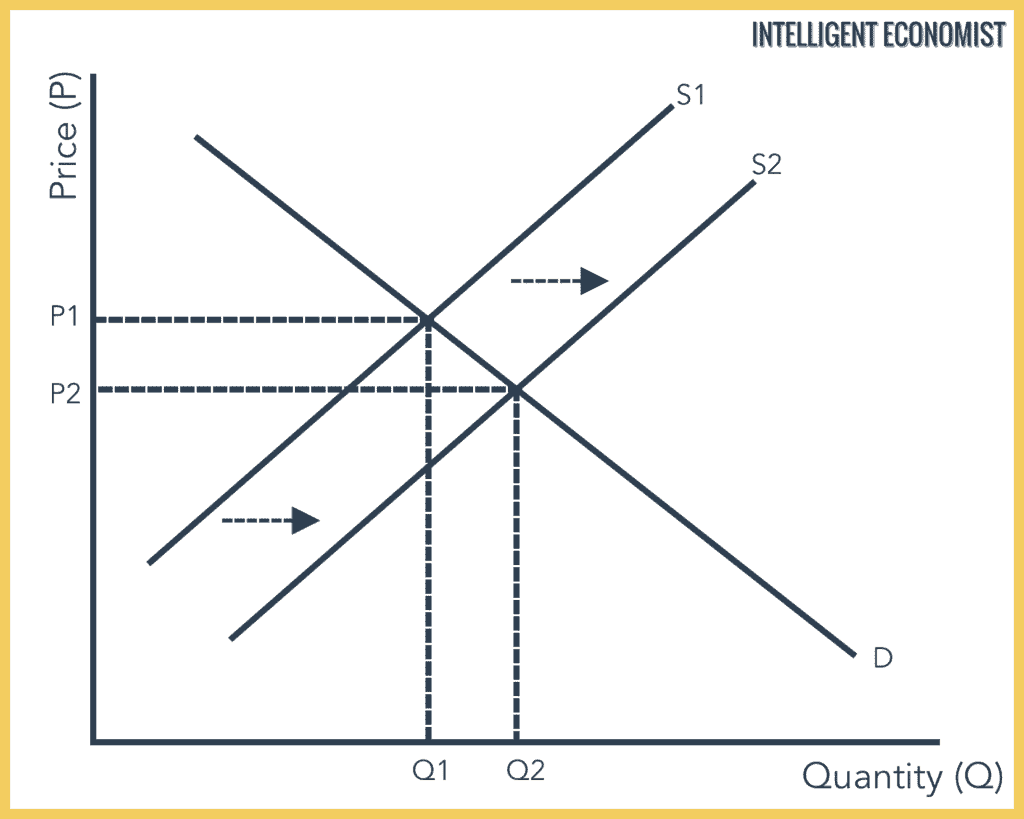
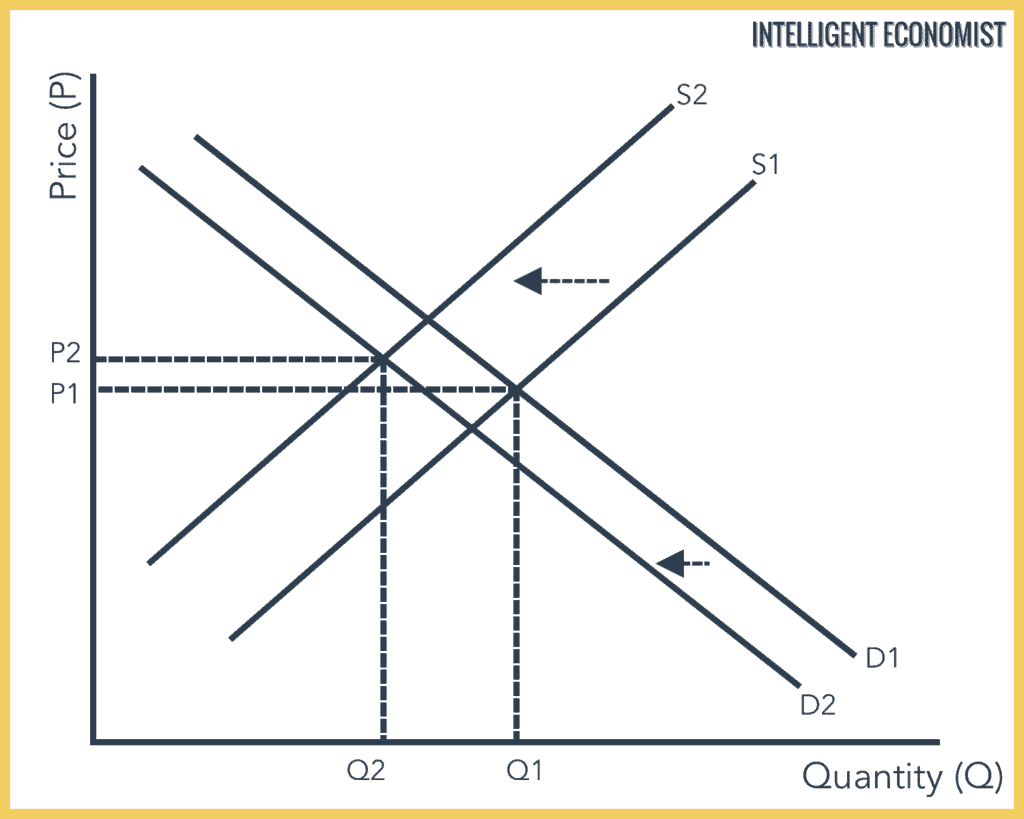
Determinants are factors that can cause the entire supply curve to increase or decrease. When there is an increase in supply (see graph below), the supply curve will shift to the right. At every price level, there is an increase in quantity supplied. When there is a decrease in supply (see graph below), the supply curve will shift to the left. At every price level, there is a decrease in quantity supplied.

There are several determinants of supply that cause the shift to the right (increase in supply) or the shift to the left (decrease in supply). We are going to use the acronym R-O-T-T-E-N as a way to remember all of the determinants.
- R - Resources
- O - Other good prices
- T - Taxes
- T - Technology
- E - Expectations of the supplier
- N - Number of competitors

If supply increases (shift to the right) it could be due to the following changes:
- R - Resources increase ⬆️
- O - Other good prices' decrease ⬇️
- T - Taxes (and other government regulations) decrease ⬇️
- T - Technology increases ⬆️
- E - Expectations of the supplier increase ⬆️
- N - Number of competitors decrease ⬇️

If supply decreases (shift to the left) it could be due to the following changes:
- R - Resources decrease ⬇️
- O - Other good prices' increase ⬆️
- T - Taxes (and other government regulations) increase ⬆️
- T - Technology decrease ⬇️
- E - Expectations of the supplier decrease ⬇️
- N - Number of competitors increase ⬆️
💡Remember: A change in quantity supplied and a shift in supply are two distinct transformations. A decrease or increase of supply happens due to a variety of factors, whereas the change in quantity supplied happens solely due to a change in price.
Browse Study Guides By Unit
💸Unit 1 – Basic Economic Concepts
📈Unit 2 – Economic Indicators & the Business Cycle
💲Unit 3 – National Income & Price Determination
💰Unit 4 – Financial Sector
⚖️Unit 5 – Long-Run Consequences of Stabilization Policies
🏗Unit 6 – Open Economy - International Trade & Finance
📝Exam Skills: MCQ/FRQ

Fiveable
Resources
© 2023 Fiveable Inc. All rights reserved.