J
Jeanne Stansak
dylan_black_2025
AP Microeconomics 🤑
95 resourcesSee Units
What is a Factor Market?
In this unit, we focus on the factor market (i.e. resource market) from the Circular Flow diagram. The factor market is where the factors of production are sold by households to businesses. The factors of production are land, labor, capital, and entrepreneurship. The corresponding payments for these factors of production are rent, wage, interest, and profit.
In the factor market, the demand for resources is determined (derived) by the products they help to produce. We call this concept derived demand. For example, the demand for carpenters is derived from the demand for homes. If there was a spike in demand for new houses, demand for carpenters will increase as well.
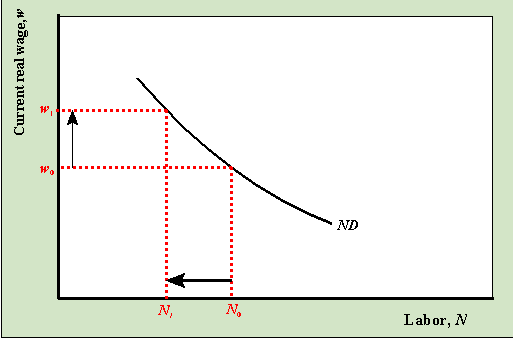
In the factor market, the demand for labor is downward sloping because the number of workers that businesses are willing to hire increases as the wage falls. In the factor market, the supply of labor is upward sloping because the number of workers that are willing and able to sell their labor increases as the wage increases. This has similar logic to the traditional law of demand we learned in unit 2.

A labor demand curve. As wage rises, the quantity of labor demanded by firms decreases, and vice versa
Another reason there is a downward-sloping demand curve for resources is the law of diminishing marginal returns. The law of diminishing marginal returns says that as variable resources are added to fixed resources, the additional output produced from each new input will eventually fall. This basically means that at some point, each additional worker used in the production process becomes less productive. This concept goes along with the saying "Too many cooks in the kitchen."
For example, if you have a factory that has a limited size, but you continue to hire workers, at some point, the workers will get in each other way because you are adding them to a fixed resource, the factory. They will become less productive, and the input that each new worker brings to the table will fall. This leads to the inverse relationship because each additional unit of a resource becomes less and less productive and generates less revenue for a firm. The firm will only hire additional workers or purchase additional resources if the wages fall or the cost of resources falls.
💡When wage level increases, the quantity of inputs demanded decreases.
💡When wage level decreases, the quantity of inputs demanded increases.
Analyzing Factor Productivity
Marginal Resource Cost (MRC)
As this term implies, marginal resource cost is the cost of hiring one more worker (or buying one additional unit of a factor, but we typically look at labor as our main factor in unit 5). For a worker, this would be the wage rate, since if we hire one additional worker, we incur the payment of that worker, which is by definition the wage rate. If we were buying capital, this would be typically the user cost of capital, which is the cost of running a piece of capital.
If we only hire workers, then MRC is exactly the wage, and our total labor cost is MRC * n where n is the number of workers we hire (which we'll figure out how to determine soon).
Marginal Product and Marginal Revenue Product (MP and MRP)
Each number of workers will produce a different number of goods. For example, if we hire 5 chefs in a pizza shop, they might produce 10 pizzas. If we increase to 6 chefs, that might rise to 13. 10 and 13 are examples of total product for 5 and 6 chefs respectively. Total product is, as the name implies, the total amount of product produced by some number of workers. Marginal product (MP) is the additional product produced by hiring one more worker. MP can be positive, negative, or zero.
What firms really care about, however, is how much money they make. Thus, we can calculate the marginal revenue product for a worker. This is the additional revenue produced by hiring one more worker. This can be calculated by taking the marginal product and multiplying by the price (MRP = MP * P).
Diminishing Marginal Product / Diminishing Marginal Revenue Product
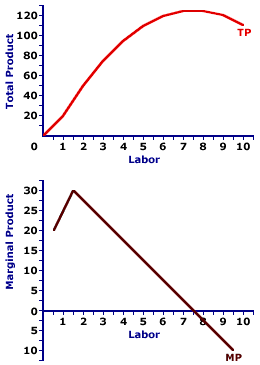
As we discussed earlier, we can observe diminishing marginal product as we hire more and more workers. First, we see increases in total product at a slowing rate, and eventually, MP hits zero, and then negatives. When MP decreases, so does MRP, so we can conclude that there is also diminishing MRP as we hire more workers. This means that eventually there will come a point where hiring an additional worker will actually lose our firm revenue. This could be because of overcrowding or a number of other reasonings.

In the above graphs, we see marginal product first increases for the first few workers. This means that TP increases at a faster and faster rate. However, at around 2 workers MP begins diminishing. This does NOT mean that each additional worker loses product, but means that the increase gets smaller and smaller for each additional worker. This can be seen in the total product graph, which has an inflection point around Labor = 2 and then begins decreasing when MP becomes negative at around Labor = 7.5.
Profit Maximization (MRP = MRC)
Like always, the primary goal of a firm is to maximize profit. In units 3 and 4, we observed that a firm maximizes profit when MR = MC, since otherwise we either have not earned all potential profit or have overshot and begun incurring additional costs. The same idea can be found in factor markets, where a firm maximizes its profit / should hire up to the point where MRP = MRC.
This logic is again, pretty much the same as MB = MC and MR = MC:
When MRP > MRC, we still have revenue to gain, so we should keep hiring until we're no longer making a profit on our worker (sounds slimy to say we profit off of our workers, but hey that's economics for ya). When MRP < MRC, we shouldn't hire that worker, since it actively costs our firm money to hire them. Thus, the market equilibrates when MRP = MRC. We've exhausted all potential profits without incurring a loss on a worker. This rule will be imperative to solving problems about how many workers to hire and understanding perfectly competitive and monopsonistic labor markets.
Hiring Labor or Other Resources
The rule for hiring labor and any other resources is that firms will continue to hire workers and resources as long as marginal revenue product (MRP) > marginal resource cost (MRC) and until marginal revenue product (MRP) = marginal resource cost (MRC). A firm will never hire when marginal resource cost (MRC) > marginal revenue product (MRP).
Let's look at an example involving the hiring of workers. In this particular example, we will say the price of the product is $3 and the wage rate is $30/hour. This means our MRC is always

Steps to solve this problem:
- If you are only given the number of inputs and the total product (TP), find the marginal product (MP). Remember, marginal means additional! For example, when moving from 1 to 2 inputs, the TP changes from 40 to 60. 60-40=20, so our MP at 2 inputs is 20.
- Multiply the MP by the price (P) of the product to find marginal revenue product (MRP). For example, the MP at 2 inputs is 20, and the product's price is $3. 20 x $3 = $60 of MRP.
- Compare the marginal revenue product (MRP) to marginal resource cost (MRC) at each input level in order to find the number that inputs that gets us closest to MRP = MRC, without MRC being greater than MRP. In this particular example, 4 inputs makes MRP = MRC ($30 = $30), so the firm will hire 4 workers.
Bonus Problem! Assuming a fixed cost of $30 and no variable costs outside of labor costs, what is the overall profit for this firm?
Profit = TR - TC, and since we produce 85 units for a price of $3, TR = 85 * 3 = 255.
TC = FC + TC = 30 + 4 * 30 = 150
Thus, Profit = 255 - 150 = $105.
Browse Study Guides By Unit
💸Unit 1 – Basic Economic Concepts
📈Unit 2 – Supply & Demand
🏋🏼♀️Unit 3 – Production, Cost, & the Perfect Competition Model
⛹🏼♀️Unit 4 – Imperfect Competition
💰Unit 5 – Factor Markets
🏛Unit 6 – Market Failure & the Role of Government
🤔Exam Skills
📚Study Tools

Fiveable
Resources
© 2025 Fiveable Inc. All rights reserved.