J
Jeanne Stansak
AP Microeconomics 🤑
95 resourcesSee Units
What is an Externality?
An externality is a third-person side effect of an economic decision that impacts someone other than the original decision-maker.
There are two types of externalities within our society, positive and negative. A negative externality is a situation that results in external costs to others, causing the marginal social cost to be higher than the marginal private cost. When the government needs to correct this situation, they will put a per unit tax in place that can help mitigate the effects of the negative externality and force the firm to produce the socially optimal quantity.
A positive externality is a situation that results in external benefits for others, causing the marginal social benefit to be higher than the marginal private benefit. When the government needs to correct this situation, they will put a per-unit subsidy in place that can help mitigate the effects of the positive externality and force the firm to produce the socially optimal quantity.

Pollution is one of the most common examples of a negative externality. The firm's private costs aren't affected by pollution, but the social ramifications and social costs are VERY real.
Negative Externalities
A negative externality exists when there is an external cost separate from the internal costs to the firm. A common example of a negative externality is smoking, which contributes to pollution and harm others through secondhand smoke exposure. 🚬
Another example is a factory that produces pollution, which can have negative effects on society, such as diminishing the quality of the water supply and atmosphere. 🏭
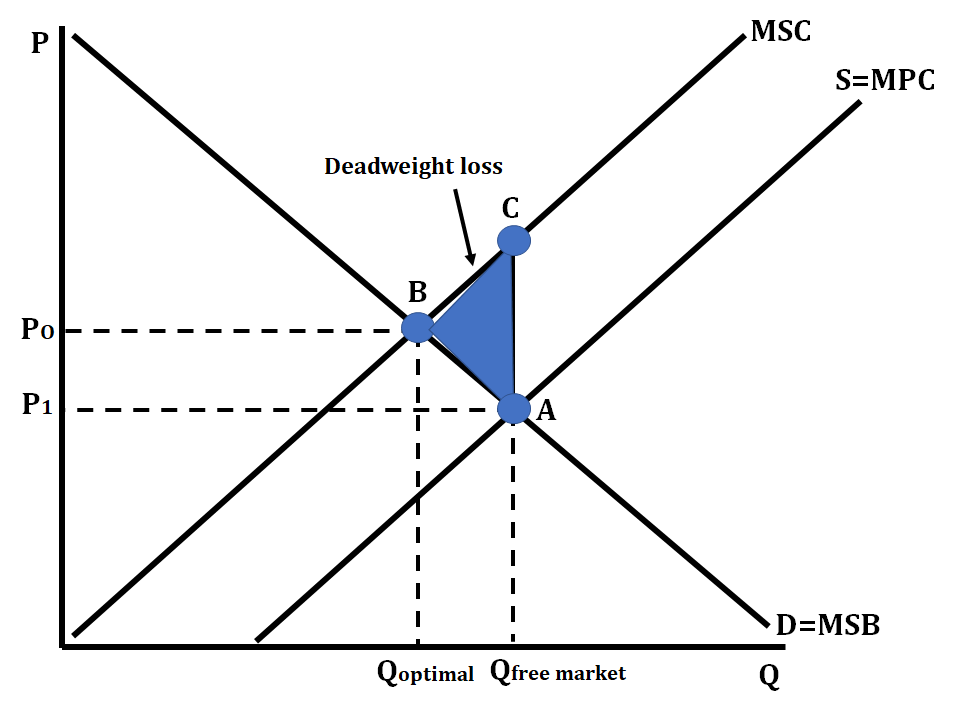
The graph for a typical negative externality looks like:

When a firm chooses to produce a good or service, it does not take into effect the external costs to society. It just looks at its own production costs. Looking back at the previous example, a cigarette company only looks at the costs associated with producing a pack of cigarettes, but it does not take into consideration the societal costs that come along from exposure to second-hand smoke.
The other example mentioned was a factory; when a good is produced in a factory, it can lead to a byproduct of pollution that will affect society. This pollution may enter the water supply or air, but the firm is only looking at their own costs, which are known as private costs. The marginal private cost of production is the additional cost to the firm of producing one more unit. It is not necessarily equal to MSC.
In the graph above we can see that at the free market quantity, the marginal social cost (MSC) is greater than the marginal private cost (MPC). This is marked by point C on the graph above. This essentially means that society is experiencing more costs than the firm at that quantity. A private firm will produce at the point where marginal social benefit (MSB) equals marginal private cost (MPC). In the graph above, this is point A. In general, a firm always produces when Qd = Qs, and if MSC != S, then there will be some externality on the production side.
Society would like the firm to produce at the socially optimal quantity, which is where marginal social benefit (MSB) = marginal social cost (MSC). This is point B on the graph above. In a negative externality, there are spillover costs (which shows inefficiency) and deadweight loss is created (on the graph this is the area ABC).
To correct this inefficiency and produce the quantity best for society, the government places a per-unit tax on the good or service. In an effort to avoid the per unit tax, the firm will reduce the quantity of good they are producing, which shifts the S=MPC curve left to the MSC curve, and brings them to where marginal social benefit (MSB) equals marginal social cost (MSC).
Positive Externalities
A positive externality is where there is an external benefit to society other than the consumer who has purchased the good or service. One common example of a good with a positive externality is the flu vaccine. When a consumer receives a flu shot, they are only considering the benefit to themselves, but society also benefits because they will be contributing to herd immunity and protecting others in the community. 💉
Another example of a good with a positive externality is education. The more educated our society is, the less we will have issues like crime. 👨🏽🏫 We will be a more productive society as well. 📈
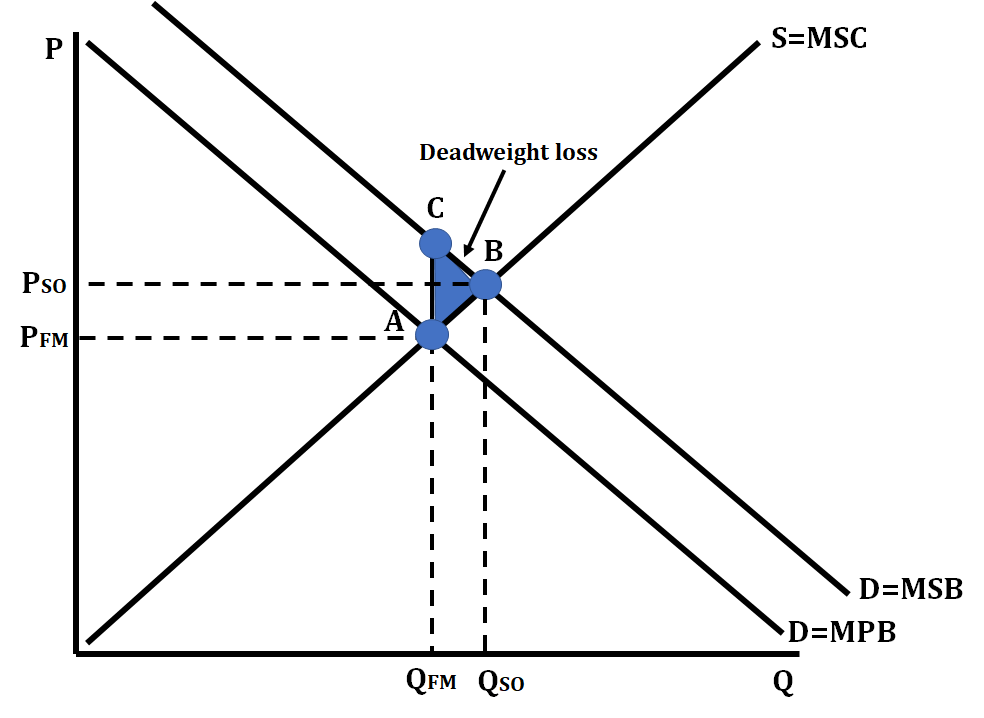
A typical positive externality graph looks like:

You can see in the graph above that at the free market quantity (QFM), marginal social benefit (MSB) is greater than marginal private benefit (MPB). This is marked by point C on the graph above. This essentially means that society is experiencing more benefits than the firm at that quantity. Society would like the firm to produce at point B, which is where marginal social benefit (MSB) equals marginal social cost (MSC). By producing at the free market quantity, a deadweight loss is created. This is marked by the triangle ABC on the graph.
Consumers only consider the marginal private benefit (MPB) of consumption, so consumers will consume until MPB = MSC, and that is where the good will be supplied. To account for the spillover benefits, the government provides a per-unit subsidy to consumers for each unit of the good. When this is done, it makes the good less expensive to buyers which increases the demand for the good. Firms will increase the production of the good to the socially optimal quantity to meet the increased demand.
Pigouvian Taxes and Subsidies
How do we solve an externality? When a market fails, this means that we can't trust the invisible market mechanisms to fix itself (since the market itself is failing!). Thus, we need an outside entity to correct the market. This entity is almost always the government.
The government can use per-unit taxes or per-unit subsidies to shift the MSC curve to the point where we produce at the socially optimal quantity. These are called Pigouvian taxes and susidies after French economist Arthur Pigou who theorized them in 1920 in The Economics of Welfare. The exam will just refer to them as a per-unit tax or per-unit subsidy like always, but hey, history is cool!
Negative Externality and Per-Unit Tax
A tax on a negative externality will shift MPC up and to the left, theoretically until it equals MSC. This will remove the externality and force production at the socially optimal quantity. Remember, a negative externality causes overproduction in the market, so a tax cuts production back, but for a good reason.

In the above graph, we see that we should apply a per-unit tax the size of the vertical distance between MPC and MSC (S1 and S2 in this graph respectively). This would shift MPC (S1) until it exactly equals MSC.
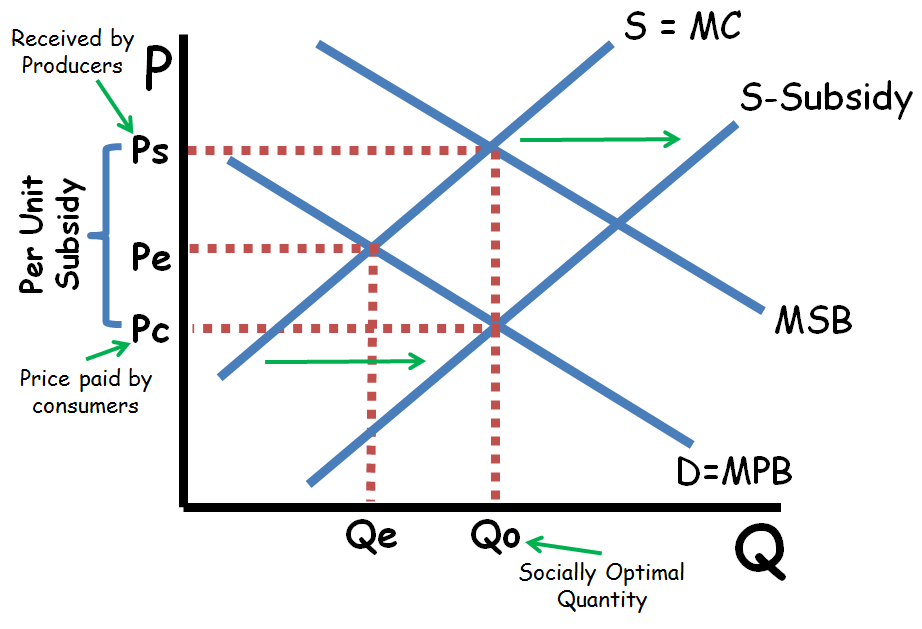
Positive Externality and Per-Unit Subsidy
The opposite is applicable to a positive externality. A positive externality implies underproduction, so the government needs to encourage production with a per-unit subsidy. This will shift MPC down and to the right until we produce at the socially optimal quantity.

Example Question
The AP Exam loves externalities. This is because they test your understanding of a few different things. To fully understand externalities you need to understand the base concept, but also have to have a strong understanding of many unit 2 concepts like supply and demand, market equilibrium, market disequilibrium, and surplus/deadweight loss. Let's take a look at a sample question from an AP Exam.
AP Micro 2017 Question 3

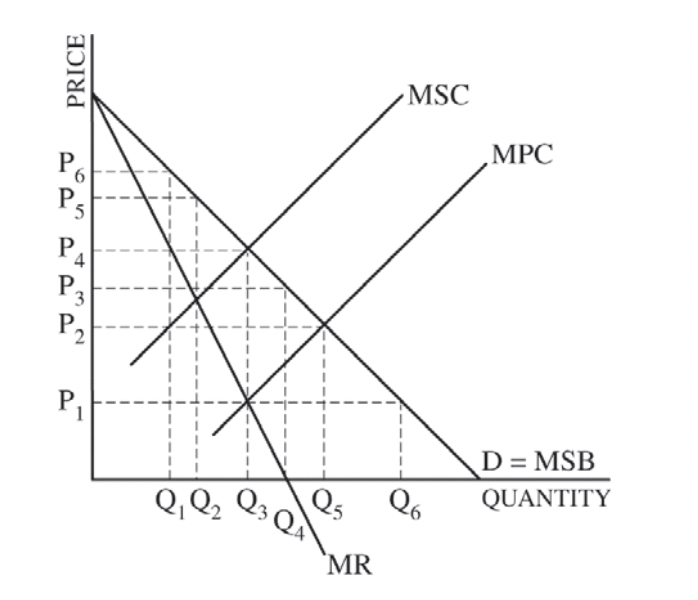
The graph above shows the marginal social cost (MSC), marginal private cost (MPC), marginal social benefit (MSB), demand (D), and marginal revenue (MR) curves for a monopoly.
Wait! You may yell, we haven't looked at a monopoly externality! It's scary, but this is actually pretty much the same topic! Remember, a monopoly is just a firm that is the entire market. An externality is an externality, even in a monopoly!
a) What is the monopolist's profit maximizing price and quantity?
b) What information on the graph indicates that there is a negative externality?
c) Identify and explain the socially optimal quantity.
d) In the case in which the government imposes a per-unit tax equal to the marginal external cost, identify each of the following.
i) The dollar value of the tax, using the price labels from the graph
ii) The profit-maximizing quantity associated with the tax
e) Given the monopoly facing the negative externality, would the deadweight loss increase, decrease, or stay the same as a result of imposing the per-unit tax? Explain.
Answer + Explanation
This is a really tough question. Students on this exam averaged a 3.24 out of 7 possible points, meaning on average students got less than half of the points available. However, this problem isn't as hard as it looks if we just apply what we know about negative externalities and about monopolies.
a) A monopolist produces where MR = MPC (since MPC is the private cost) and charges the highest willingness to pay at that quantity. This is Q3 and P4 on the graph.
b) We know there is a negative externality because MSC > MPC. This implies that the social costs of production are higher than the private costs, meaning there are external social costs that society feels from production.
c) The socially optimal price and quantity is where MSC = MSB. This is at Q3.
d i) The size of the tax needs to be the vertical distance between the two cost curves, which is P4 - P1.
d ii) The new profit-maximizing quantity is where S = MSC = MPC (they're equal after the tax) equals D = MSB. This is at Q2.
e) This part is a little weird. The deadweight loss increases because the monopolist’s profit-maximizing quantity is equal to the socially optimal quantity before the tax and is less than the socially optimal quantity after the tax. It may seem like taxing the monopoly is the right move since we get rid of the discrepancy between MSC and MPC, but in fact a tax increases deadweight loss because it forces the market to underproduce.
Browse Study Guides By Unit
💸Unit 1 – Basic Economic Concepts
📈Unit 2 – Supply & Demand
🏋🏼♀️Unit 3 – Production, Cost, & the Perfect Competition Model
⛹🏼♀️Unit 4 – Imperfect Competition
💰Unit 5 – Factor Markets
🏛Unit 6 – Market Failure & the Role of Government
🤔Exam Skills
📚Study Tools

Fiveable
Resources
© 2025 Fiveable Inc. All rights reserved.