5.1 Introducing Statistics: Why Is My Sample Not Like Yours?
2 min read•june 4, 2020
B
Brianna Bukowski
Josh Argo
AP Statistics 📊
265 resourcesSee Units
Sampling Distribution Defined
A sampling distribution is a distribution of all possible samples of a given size. In the previous units, every distribution consisted of one sample, such as a class of students grade in a class. With a sampling distribution, you take the average of all means (quantitative) or proportions (categorical) of each possible sample size (n) and use these averages as your data points. The normal model now also represents the distribution of all possible samples of a given sample size.
Differences
To find the sampling distribution for differences in a sample proportion or mean, remember that variances always add to find the new variance. If one needs the standard deviation, you should take the square root of the variance. However, for means you can just subtract.
Discrete vs. Continuous Random Variables
There are two major types of random variables in AP Statistics: Discrete and Continuous. Discrete Random Variables are variables that have a certain and definite set of values that the variable could be. Usually, these are whole numbers in real world situations (1, 2, 3, 4, 5…, 100, etc.). For Discrete Random Variables, to calculate the mean, you use the expected variable formula:
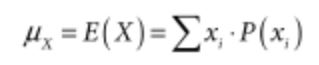
Source: AP Statistics Formula Sheet NEW FOR 2020
For Discrete Random Variables, to calculate the standard deviation, you use a formula similar (in a way) to the expected value formula, but with a square root:.
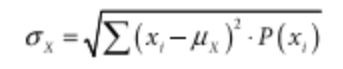
Source: AP Statistics Formula Sheet NEW FOR 2020
The other type of random variable, Continuous Random Variables, can take on any value at any point along an interval. Generally, Continuous Random Variables can be measured while Discrete Random Variables are counted. A histogram is used to display continuous data, while a bar graph displays discrete data!
Parameters vs Statistics
In AP Statistics, you will be asked to compare Statistics from a Sample to the Parameters of a Population. Here is a chart to help you remember which symbols are from sample statistics and from population parameters:
Measurement | Population Parameter | Sample Statistic |
Mean | 𝝁 | x̅ |
Standard Deviation | σ | s |
Proportions | 𝝆 | p̂ |
Browse Study Guides By Unit
👆Unit 1 – Exploring One-Variable Data
✌️Unit 2 – Exploring Two-Variable Data
🔎Unit 3 – Collecting Data
🎲Unit 4 – Probability, Random Variables, & Probability Distributions
📊Unit 5 – Sampling Distributions
⚖️Unit 6 – Proportions
😼Unit 7 – Means
✳️Unit 8 – Chi-Squares
📈Unit 9 – Slopes
✏️Frequently Asked Questions
✍️Free Response Questions (FRQs)
📆Big Reviews: Finals & Exam Prep
Fiveable
Resources
© 2023 Fiveable Inc. All rights reserved.