9.1 Introducing Statistics: Do Those Points Align?
3 min read•april 28, 2021
Josh Argo
AP Statistics 📊
265 resourcesSee Units
9.1: Introducing Statistics: Do Those Points Align?
As discussed in section 9.0, Unit 9 deals with scatterplots and our ultimate question is how well our points from our sample align. In some cases, they align to a line; in other cases, possibly an exponential or quadratic equation. In AP Statistics, we primarily only focus on linear regression models. If they are not in a linear pattern, we know some techniques we can use to make our points better fit a linear pattern. (See Unit 2.9)
Correlation
In our linear regression models, we are aiming at measuring the correlation between the two variables based on our data set. One thing that is important to note is that sometimes correlation may seem present, however, it is due to merely random chance.
For instance, we can measure the inches of rain for every day and the number of the day of the month it was and plot the points with the day of the month on the x axis and inches of rain on the y axis. It is possible that we may see some sort of pattern that appears that the two things are correlated even though we know that is nonsense. This “correlation” would be due to random chance alone and not some sort of relationship between our two variables.
Also, it is so important to remember: correlation does not mean causation!
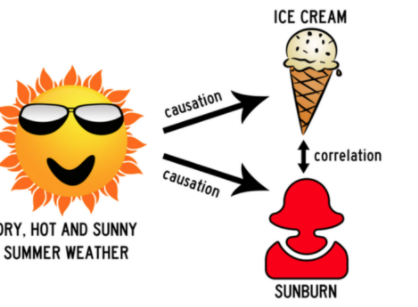
Image Taken From Towards Data Science
Causation
As we stressed in Unit 2, two variables may be correlated, but that does not establish a cause and effect relationship. As in the example above, a hot sunny day causes the ice cream to melt and it also causes sunburn. However, it would be silly to say that ice cream melting causes sunburn. The two things are correlated due to another variable: the hot sun (which influences ice cream consumption and sunburn).
Just like with any statistical study, it is wise to investigate any other variables that may be playing a part in your outcome. These variables are called confounding variables.
Repetition
A good scientific way to ensure that your results are not due to random chance is to do two things:
- Have a large sample size for your data set.
- Repeat the study in multiple populations with several large random samples.
For instance, consider the COVID vaccine trials. When performing the clinical trials, it was imperative that they were using a large sample to randomly assign treatments. This ensured the safety of the vaccine across a broad scope but also reduced any correlation in our pattern to a non-random correlation, not just pure sampling variability between the placebo group and vaccine group.
Also, the same clinical trials were performed in multiple samples in various countries. This supports the effectiveness of the vaccines across multiple populations and strengthens the cause for vaccine administration around the globe. Yay for good news! 👏👏
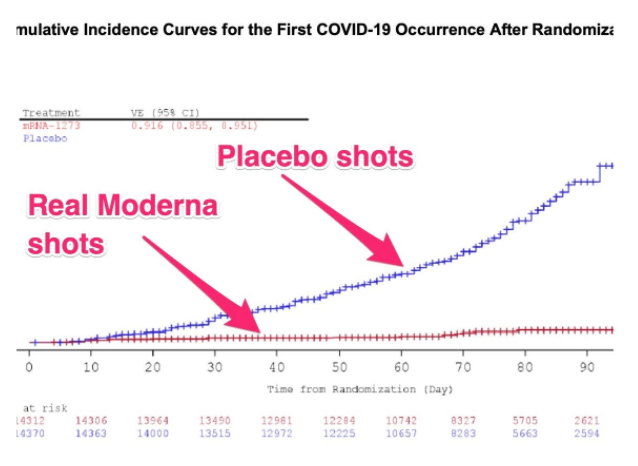
Image Taken From Business Insider
🎥 Watch: AP Stats Unit 9 - Inference for Slopes
Browse Study Guides By Unit
👆Unit 1 – Exploring One-Variable Data
✌️Unit 2 – Exploring Two-Variable Data
🔎Unit 3 – Collecting Data
🎲Unit 4 – Probability, Random Variables, & Probability Distributions
📊Unit 5 – Sampling Distributions
⚖️Unit 6 – Proportions
😼Unit 7 – Means
✳️Unit 8 – Chi-Squares
📈Unit 9 – Slopes
✏️Frequently Asked Questions
✍️Free Response Questions (FRQs)
📆Big Reviews: Finals & Exam Prep
Fiveable
Resources
© 2023 Fiveable Inc. All rights reserved.