Dylan Black
AP Chemistry 🧪
269 resourcesSee Units
7.8: Representations of Equilibrium
So far in unit 7, we’ve represented equilibrium both in terms of reactions (Ex. A ⇌ B) and mathematically. In this section, we’ll start looking at how we can view equilibrium using particulate models.
Remembering What Exactly Equilibrium Is
In the last few sections, we’ve gotten bogged down in math on math on math calculating everything from equilibrium constants to equilibrium concentrations. While knowing the math behind equilibrium is good and definitely applicable on the AP exam, it is just as important to have a firm understanding of what exactly equilibrium means and how we can represent it pictorially. Equilibrium describes how far forward a reaction goes. Some reactions go forward nearly entirely whereas for others they do not go forward much at all. This means that at equilibrium, the concentrations of products for various reactions may vary.
On a particulate level this can be described as seeing more product than reactant or more reactant than product at equilibrium. An easy way to remember this fact is also to use the math we’ve learned! For example, take a look at the following practice problem:
Consider the following reaction:
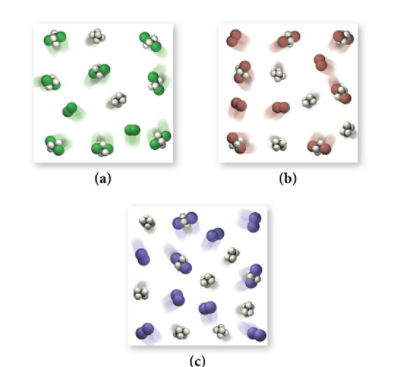
C2H4 +X2 ⇌ C2H4X2
where X2 can be Cl2 (green), Br2 (brown), or I2 (purple).
Examine the three figures below representing equilibrium concentrations in this reaction at the same temperature for the three different halogens.
Rank the equilibrium constants for these three reactions from largest to smallest.

We could count each product molecule and reactant molecule and divide for each particulate model, however, let’s remember that equilibrium simply tells us how far forward a reaction goes and a higher equilibrium constant corresponds to a farther forward reaction. Therefore, we can simply compare the number of product molecules between the three vessels and find that (a) has the largest K and © has the smallest with (b) laying in the middle.
Practice Problem
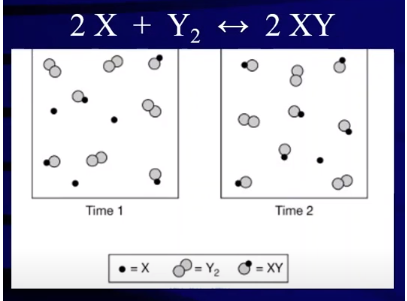
Consider the following particulate diagram:

Which way has the reaction shifted?
Let’s figure out which direction the reaction has shifted by comparing the amount of product (XY) in the vessels at time 1 and time 2. At time 1 we have 4 XYs and at time 2 we have 5 XYs implying that our reaction has produced products over the time period. Therefore our reaction has shifted right over this time period. We can see that the reaction went further forward because we see an increase in the concentration of products and conversely we see a decrease in the concentration of reactants. At time 1, there are 3 X’s and 4 Y2 molecules. At time 2, we see that both of these values have decreased and we now have 1 X and 3 Y2s. Taking a look at the reaction we see a reduction in concentration equal to the stoichiometric coefficients in the reaction. This tells us that in fact we saw a conversion of reactants into products, furthering the idea that the reaction shifted to the right.
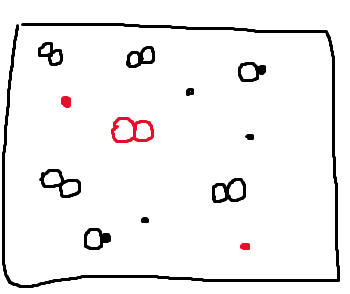
What would the box look like at time 2 if the reaction had shifted the opposite direction?
Let’s think about what would happen if from time 1 our reaction, instead of producing products, instead shifted left and produced reactants in the reverse direction. When the reaction shifts left, we will have 2 XY molecules breaking apart to form the reactants, 2 Xs and 1 Y2. We know this by looking at the reaction and seeing that 2XY molecules react in the reverse reaction to form 2X and 1Y2. Therefore, the reverse reaction will lead to a production of this amount of reactants. This can be represented by drawing the following:

In red are the new molecules that we’ve formed from the breaking up of 2XYs. If you compare the time 1 box and our new particulate diagram, you’ll see that we removed 2XYs that react in the reverse reaction to form the new 2X and Y2 molecules.
Particulate Representations on the AP Exam
The majority of unit 7 focuses on mathematical representations of equilibrium. We’ve seen this in the form of calculating equilibrium constants and using ICE Boxes to calculate equilibrium concentrations. In the coming sections we’ll use new theories to make both qualitative and quantitative analyses of equilibrium. This unit is in a way “squished” in between these two topics as a reminder that equilibrium does not have to be strictly math! In fact, understanding equilibrium conceptually is a super powerful tool because not only does it mean the formulas and math will make more sense but it also means that you’ll be able to properly explain your answers which is invaluable on FRQs. The CollegeBoard also loves to test conceptual knowledge on equilibrium on MCQs where they can give separate answers for a question. You may also see particulate representations in FRQs where, like in part (b) of our practice question, you will be asked to draw a new solution based on a reaction or shift in equilibrium. This section usually goes overlooked but in fact it’s one of the most important in understanding the concepts of equilibrium!
Browse Study Guides By Unit
⚛️Unit 1 – Atomic Structure & Properties
🤓Unit 2 – Molecular & Ionic Bonding
🌀Unit 3 – Intermolecular Forces & Properties
🧪Unit 4 – Chemical Reactions
👟Unit 5 – Kinetics
🔥Unit 6 – Thermodynamics
⚖️Unit 7 – Equilibrium
🍊Unit 8 – Acids & Bases
🔋Unit 9 – Applications of Thermodynamics
✏️Frequently Asked Questions
✍️Free Response Questions
🧐Multiple Choice Questions
📆Big Reviews: Finals & Exam Prep

Fiveable
Resources
© 2023 Fiveable Inc. All rights reserved.